Clockenflap, like most festivals, is largely a temporary venue. This year it's a new venue to Clockenflap on the Central Harbour-front Event Space. I looked at the area on OSM and how to map the temporary stuff that the event will put up. There's seven stages, food stalls, bars, attractions, art installations and all the usual support stuff like toilets, first aid and entrance and exit gates. That's a lot of stuff to add to OSM temporarily. Worst of all, when I started to look at it the site design was still not fixed. I quickly decided that it needed to be stored locally and not uploaded to OSM at all.
The map is embedded in an app, which I'm not writing. The idea is to run the map in a Webview with a JavaScript Leaflet-based display and it works well. The map has a base layer with all the services on it and layers of overlays with icons that can be clicked. In the apps (one iOS and one Android) the JavaScript in the Webview calls a native iOS or Android function when an icon is touched. So instead of a web popup the app can respond with a dialog or a more detailed response. For example, if a stage icon is touched the app can show what acts are on the stage now and on next. The reverse is true too. For example, if the user scrolls through the list of food suppliers in the app and chooses one, the map is called and shows where the food stall is on the site. I can't show the apps yet, but a working example of the map is here.
The festival team provided the icons and the look of the map. I think it looks very good. There are sponsors who need to see their logos and colour schemes and the map needs to reflect this, as well as being useful for getting around on a site that no one knows their way around because it is only a day or two old.
A few things are quite different from most of the maps I've made before. Driving the map from a phone screen is a challenge. Trying to get specific icons on the map so they are big enough to read on smaller screen, but don't overlap too much is tricky. At the lowest zoom level (17) very little is shown by default. If all the overlays are show it is a jumble, there's just no choice.
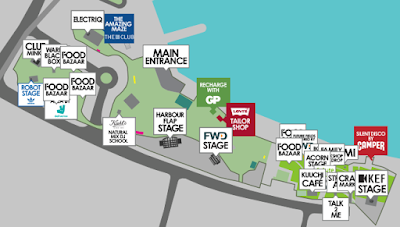 |
| Lots to fit on at low zoom if everything is turned on |
 |
| Food stalls need room for their much longer real names |
There is an optical illusion when you zoom in on an icon, especially on a phone where you use pinch zoom. If you show the higher zoom level with the same size icon on it the icon seems to have shrunk. People expect pinch zoom to make things bigger, so I increase the size of the icons as each level zooms in. That is easy for the stuff on the base map, Tilemill makes that simple, but scaling the icons on overlays took a bit of code I'd not needed to use before. This involves resizing the icon and using setIcon() to use the newly sized icon in a marker. setIcon() is not documented in Leaflet 0.7, but works just the same.
The standard Leaflet layer control is much too small for a mobile phone. I tweaked the size and position with CSS. I also discovered that you don't need a base layer on the control and you can force it to always be open. Both are perfectly plainly described in the really good documentation of Leaflet, I'd just not read that bit before.
I control the markers on the map by describing them in geoJson files, one for each overlay. To position the many markers on the map I created a simple editor which uses the Leaflet.Draw plugin, which is really simple to use in code and produces a very useful editor.
I have enjoyed creating this map and working with creative people who have an absolute deadline to work to. If you are in Hong Kong on 25 - 27th November enjoy Clockenflap and enjoy using my map to find all the stuff Clockenflap has to offer.