Wednesday, 22 August 2012

OSM should not have a database

Openstreetmap should not have a database. Having a database positively hurts the whole community. There, I've said it and I feel better already.

Where there is a database there are nerdy types who want to normalise it, formalise the ontology of it, rationalise it, enhance its performance and all the other things computer science bods and other nerds love to do. They do it because their training or their gut feel tells them it must be an improvement that everyone will welcome it. They are wrong.

If OSM didn't have a database, it would be easier to explain that we don't do that, and we don't want you to do that either. It would be easier to direct these meddling nuisances to some other project, maybe opendatabasewrangling or openstringuntangling. That way we could keep the freedom to carefully choose the tags we use without the risk that some prat would mass-edit them into his view of an organised world, losing all the detail and nuances carefully placed there by hundreds of other mappers. The really, really annoying thing is that most of these people don't actually consume the data in a useful way, it just seems like a good idea to them. If they did use the data they would quickly see that selecting the data you want with a little preprocessing is easy and you always have to do this, so adding some extras to cope with variety is fairly simple. Write the code once and it works over and over again.

Of course we need to store the data somewhere and in reality that needs to be a database, such as the one we have. I must make it clear that I'm not criticising the database, it's design or the way it is managed or run at all, just the fact that something called a database attracts unwelcome urges from a few people. Maybe we could just stop calling it a database. Can we rename it to the tag-pile, or the OSM toy-box or anything that doesn't convey 'database'?

I wish the people who want to reduce the tags to a proscribed list well - I just wish them well somewhere outside of OSM. If they want an organised, limited list of tags, take OSM data and play with it in their world as they want to - just don't upload the changes as a mass-edit back into our toy-box. There is real value in nuanced data and, more importantly, real value in not upsetting the mappers whose carefully chosen tags get squashed to homogenised blandness by these unthinking mass-editors.

What would you rename the database the place we store our data to?

Thursday, 2 August 2012

Keeping stuff up-to-date

It is all very well mapping an area, but things keep changing. A new £90 million hospital has just opened on the outskirts of Beverley and so as we passed it today we dropped in to grab a look around. Well, a look at just the grounds - I've had enough of the inside of hospitals. It was a bit unusual in two ways. Firstly there was a lot of car parking, so much so that there were many empty parking places. At the other local hospitals parking is a nightmare. The second thing was completely unexpected to me: an electric vehicle charging point. The two bays were labelled as Hybrid Vehicle Charging, but surely a hybrid doesn't need charging as much as a totally electric vehicle. A hybrid, by definition, has more than one means of power, whereas an electric vehicle needs to charge or stops.

I was able to trace the outline of the new building from the latest Bing imagery, which are very helpful, well aligned and now less than a year old - the previous ones were up to eleven years old. Nearby we spotted a new allotment site and a short detour helped add that to the map too. It is not a council site but a private one. It looks a good site. It was still a field on the new imagery, so it is pretty new.

As we drove through Beverley I noticed a lot of the residential streets have new 20 mph speed limits, so they all need surveying and updating. Speed limits don't take long to survey, so an hour wandering around should do it.

I rather enjoy looking for these changes and adding them to the map. I'm sure OSM is the only map to have both the hospital and the allotments on it right now - in fact how many other maps have allotments at all?

Friday, 29 June 2012

Leaflet vectors

Looking at a new-style speed limit made me realise that I might not have completed the speed limit tagging in Hull. I looked for a map showing speed limits as an overlay, struggled to find what I wanted and decided to put something together for myself. My last blog post about creating a map with overlays using leaflet seemed popular, so I thought I'd write up my experience here too.

I wanted to show a map with an overlay of roads that don't have a speed limit tag (maxspeed=*) so I can survey them and add the correct tag. I decided to extract all highway=* that are roads which could have speed limits, so not service roads or cycleways for example. The maxspeed tag (or absence of it) could drive an overlay to highlight missing ones and show the actual speed limits where there is a tag.

I thought I would extract the OSM data for an area, parse it to extract the relevant highways and store that in a database. Then create a page to display the map using AJAX and GeoJSON to deliver an overlay.

All of the scripts are on github, so you can download it from there. The README file includes some installation stuff to make it work for you. A working version is here, though the data will rapidly get out of date, so don't trust what you see - it is only an example.

First, get some data. I download the data for areas from Geofabrik's download server. Their service is excellent and by providing data that is less than a day old and cut into useful areas it is hard to beat. I downloaded the county data for East_Yorkshire_with_Hull. I usually download the data as .pbf a file. That can go straight into many utilities, but to use the data myself with Python I convert it to a .osm file first with osmosis.

I wrote some Python code to parse an OSM file long ago and I keep going back to it. It is included as python/osm.py. I wanted to find the ways tagged with highway. I wanted to narrow that down to a smaller group of highways: unclassified to motorways ignoring footways for example. I then wanted to load the ways into a database for use later. All of this is in the script called python/readlimits.py. My cheap and cheerful website host provides PHP and MySQL, so my database is MySQL. To draw the overlay on a map I need the list of nodes that make up the way, so I extracted them too and added them to a table too. The table layouts are in github folder database.

The script works through the ways that fit the requirements and extracts from the list of nodes that make up the way. From these it works out the most northerly, southerly, easterly and westerly of the nodes and stores this bounding box of the way. We want to show an overlay for the current part of the map being displayed and this bounding box for a way will allow that.

Loading the data for (38,000 ways and 350,000 nodes to work through) took a few minutes, loading 15,700 ways and 114,000 nodes.

Now to create a PHP script that gets called with a bounding box and returns the ways that fall, at least partially, into that area. This script will get called by an AJAX call so it needs to return data in the correct format for Leaflet to use. I use GeoJSON, which Leaflet handles well. Now we need to make a decision. Do we choose the things that get displayed and how it gets displayed in the PHP script that extracts the data or do we throw everything at the client and select there? I've decided to manage the process in the PHP. My interest is in finding which roads have no maxspeed tag, so I paint the overlay red with no tag and blue with tagged roads. The roads with a maxspeed tag get its text set for a popup, no maxspeed tag gets 'Not set'. The script is called getspeeds.php.

The HTML is simple, I create two columns side by side, managed by CSS. The map is displayed in a div, as always, this time called speedmap. The work is all done in the JavaScript showspeed.js, which has comments to guide you along. I have deliberately limited the minimum zoom to be 14 so not too much data is requested by AJAX.

I hope this will help anyone wondering about vector layers. If you have any questions, leave a comment and I'll try to answer it. If you have a better way of doing this, leave a comment linking to your solution and I'll ask you questions.

Monday, 25 June 2012

New 40 Zone

Making maps has made me look at my surroundings much more carefully. I have found things close to home that I didn't know existed and it has focussed my attention for detail. A couple of weeks ago we saw a speed limit sign which displayed the usual circular 40 speed limit, except it had the word zone written below it. We saw some more the other day and it seemed unusual, so I investigated some more. Finally I got an email from someone in the Highways department at East Riding of Yorkshire council. In it she stated

"Draft guidance from the Department for Transport on setting speed limits supports the introduction of lower limits on routes in rural areas where high speeds are inappropriate and there are significant numbers of leisure users such as cyclists, horse riders and walkers."

She goes on to explain,

"The implementation of a 40 zone requires less signage than a conventional 40mph speed limit, therefore is less intrusive on the rural environment.  Special authorisation for the signs was sought from the Department for Transport.  A Traffic Regulation Order is in place for the 40 zone, which means it is enforceable by the Police.

The routes selected for the zones are pilot schemes and are being closely monitored."

I find this both interesting and a little puzzling. Firstly I'm in favour of reducing traffic speeds on some rural roads. Fatal accident rates for both vehicles and cyclists is higher on some types of rural roads and one way to try to reduce this is slow down traffic. Speed limits alone won't help much unless they are enforced which seems highly unlikely on quiet rural roads, but it may help a little. Today I was driving along one of the newly changed roads at 40 mph being tail-gated by an impatient driver from behind and almost forced off the road by a Mercedes-moron coming the opposite way doing much, much more than 40 mph.

The signs are subtly different. The initial 40 sign is the same size as normal but has the word ZONE below it. This is in upper case, which I think breaks the usual use of mixed case. 40 mph limits normally have small repeaters every few hundred metres to remind the drivers they are in a speed limit. This does not. It does have reminders every mile or so. To me this is too far apart. The sign carries a 40 mph circular sign at the same size as the beginning of the limit with 'ZONE reminder' below.

The road itself can have extra markings. Some parts have 40 roundels painted on the road occasionally and some parts have broken white lines painted down both sides of the road, but not at sharp corners.

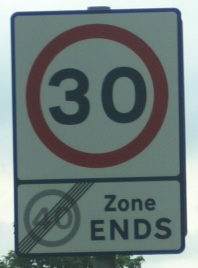
The end of the zone can either be the national speed limit or a lower limit such as 30 mph when the road enters a village, say.  Where there used to be a simple 30 mph sign there now has to be a new sign with a plaque saying the 40 zone ends.

The only other zones I have come across are 20 mph zones such as ones outside schools. Some 20 mph areas are not zones, they are simply a 20 mph speed limit. I do wonder what kind of bureaucratic mind dreams up these subtleties in the Department for Transport and imposes the hapless motorist with these distractingly different signs? 

One other point is that the guidance from the DfT is draft, so what happens if the final guidance does not include this kind of road or if the signage is different?

Tuesday, 12 June 2012

Open Data

I have been speaking to someone from a local council and they are keen to publish lots of data under an Open licence. Some of it is geo data and I'm interested in what benefit that might bring to OSM. I hope to have more to report soon.

Friday, 11 May 2012

Fire hydrant locations are confidential

Strolling around the village I saw a man working in the street. The van had a Humberside Fire and Rescue logo and the man was fixing a hydrant sign to a wall. A quick chat established that he was checking they were present and replacing imperial hydrant signs with metric ones. I asked him if any data about the location of the hydrants is available. He said he would ask someone to call me about it.

A little later I got a call from HF&R. I asked if the location of fire hydrants was available and was told in no uncertain terms that they were not. I explained about OpenStreetMap and the caller told me that OSM had no reason to add hydrants, adding that their locations are confidential. When I said that as the data is not available I would just continue to add the ones I see as part of surveys he repeated that their locations are confidential and added that they belong to Yorkshire Water, the local water company. He asked why I wanted to put hydrants into OSM and I told him that such details make a richer map.

The locations of hydrants are hardly confidential, there is a yellow sign showing where each one is. I was a bit surprised by the HF&R man's indignant reaction. It does seem that the notion of opening up data has not reached into that public body at all.

I have only added a few hydrants experimentally and stopped because it didn't seem worth the effort. I may add a few more, but not, it seems, based on HF&R data, and only under the cover of darkness.

Monday, 30 April 2012

Fungus

Fungus Auricularia auricula-judae
I'm working my way through Yorkshire Wildlife Trust nature reserves, there are 85 public reserves spread across Yorkshire, so it will take a while. Some are bigger than others and today I visited probably the smallest, Keldmarsh. It is less than half a hectare, next to a school and a housing estate on the outskirts of the market town of Beverley. There was evidence of the locals to be seen, some broken glass and the remnants of a bonfire with logs and blocks drawn up around it as seats. I mapped the wood, the boundary of the reserve, as best as I can, and the single path in it. You can see my estimates here. The YWT website hints at a pond, but even after the substantial rain over the last month there was no sign of standing water. A couple of common birds, a few early bluebells and some meadowsweet to catch my attention, until I came across a fallen branch with excellent fungi on it.