I just received an email from Ordnance Survey, telling me that OS Locator, part of the OS Open Data, is to be withdrawn in a year's time. They say that OS Open Names has been published and that replaces OS Locator. They hint that it may replace CodePoint Open too, though there's no notice of withdrawal for that yet. I thought I should look at OS Open Names to see what it offers.
The first thing I saw was that the data is broken into the OS large-scale grid squares, which break the country into a 13x7 grid with 55 squares with actual data in them. Each one of these needs to be downloaded separately to cover GB. That is a pain to start with. I requested SE and TA which are both needed to cover the village I live in. After downloading them the .zip file contains each area broken down into 100 separate sections as I would expect, but I quickly realised that there were only 25 in SE and 10 in TA. Much of TA covers the North Sea, so there should be fewer sections, but clearly many were still missing. I downloaded another area and again the same 75 sections were missing. I emailed customer service at OS to point this out, with no answer yet.
I pressed on to look at the data in the sections that were there. The data is in a CSV format (there was another choice). There is a summary of column headings, but the data is a strange muddle of three types of data. Much of the data is a url to an OS website with the data summarised on a page for each column of each line of the text. It appears that there is a record type for place names, a record type for postcode centroids and a record type for named roads all freely mixed up throughout the file. There doesn't seem to be a field to simply identify what the record type is for each line. The first field is an id field. For place names it seems to start with osgb and has a number after that, for postcodes a postcode type id, with spaces removed, is in the id field and for road names an id that looks like a GUID is in the field. It doesn't seem to be a pattern for why the data is in the order that it is.
I'm going to throw some code together to disentangle these record types and see what useful data is then available. Hopefully we will not have lost anything useful in this process, though it does look as though processing this open data is going to be a bit harder than it used to be.
Anyone would think OS don't want to release open data.
Edit: There are two fields which distinguishes these different record types.
Monday, 1 June 2015


Road Closure
The road I live on is closed. A house needs some work done on it. The house wall is tight against the road and that part of the road is also narrow. Scaffolding to work on the house now stands to the middle of the road, so the road is closed to vehicles for two weeks
Should I change the road in Openstreetmap to reflect this temporary closure? I have decided not to change it. Anyone trying to use the road in a vehicle will be directed by another route, by the signs. Most are locals so they will know the alternatives anyway. If I make a change to OSM and someone downloads a snapshot of the data with that change in place they may not download a new version for a while and have the break in the road long after it has actually reopened. Anyway the road exists - it's just not accessible to vehicles for a while.
This closure has caused some very poor driving standards to surface. The alternative routes are small residential roads with parked cars and tight and narrow corners. People using these routes seem to need to take out some annoyance with their normal route being closed by roaring through these streets at ludicrous speeds with no intention to give way to anyone else.
The closure was a surprise to me. I saw a sign go up announcing the closure a couple of days before it happened. When I tried to find out why the road was being closed I drew a blank. The council didn't respond to my request for information and searching their website produced nothing at all. A neighbour pointed out that there was a notice in the local newspaper which was reproduced online. Few few people still read the Hull Daily Mail - it has been steadily descending way below mediocrity for many years. The online notice didn't appear in my searches because it is not sensibly indexed. The HDM website is a nightmare to use, with any page constantly bouncing around as adverts and videos randomly pop up and freeze the pages.
Councils are obliged to publish public notices about some things, such as road closures. It's clear to me that publishing in the local newspaper is not a viable way to do this as they no longer reach much of the population. A sensible addition would be publish the notice on the council's website. I what the East Riding of Yorkshire council will respond to my suggestion of this.
Should I change the road in Openstreetmap to reflect this temporary closure? I have decided not to change it. Anyone trying to use the road in a vehicle will be directed by another route, by the signs. Most are locals so they will know the alternatives anyway. If I make a change to OSM and someone downloads a snapshot of the data with that change in place they may not download a new version for a while and have the break in the road long after it has actually reopened. Anyway the road exists - it's just not accessible to vehicles for a while.
This closure has caused some very poor driving standards to surface. The alternative routes are small residential roads with parked cars and tight and narrow corners. People using these routes seem to need to take out some annoyance with their normal route being closed by roaring through these streets at ludicrous speeds with no intention to give way to anyone else.
The closure was a surprise to me. I saw a sign go up announcing the closure a couple of days before it happened. When I tried to find out why the road was being closed I drew a blank. The council didn't respond to my request for information and searching their website produced nothing at all. A neighbour pointed out that there was a notice in the local newspaper which was reproduced online. Few few people still read the Hull Daily Mail - it has been steadily descending way below mediocrity for many years. The online notice didn't appear in my searches because it is not sensibly indexed. The HDM website is a nightmare to use, with any page constantly bouncing around as adverts and videos randomly pop up and freeze the pages.
Councils are obliged to publish public notices about some things, such as road closures. It's clear to me that publishing in the local newspaper is not a viable way to do this as they no longer reach much of the population. A sensible addition would be publish the notice on the council's website. I what the East Riding of Yorkshire council will respond to my suggestion of this.
Thursday, 21 May 2015
Not Alone
I went out looking for new developments in East Yorkshire today. Looks like I was not alone.


Monday, 11 May 2015
Heights & OS
Working with Digital Elevation Models (DEM) is an interesting extension to creating maps, which are usually a flat representation of part of the world. I really want to find a way to show elevation in a way that is a bit different from a flat map. Working with the OS DEM data has whet my appetite to try something new, but first I need a map to work with.
The most detailed DEM data I have is based on Ordnance Survey OpenData, so creating a map in the OS projection will be useful. I use TileMill to create maps from OSM data.
Firstly I needed OSM data in the Ordnance Survey projection. That means loading some OSM data into a fresh PostgreSQL database. I created a PostgreSQL database and, as usual, add the extension for PostGIS. this creates a table called spacial_ref_sys that includes the OS projection, amongst many others. I often add the hstore extension too, but this is a simple map so I didn't need it.
Armed with all of this I could now start TileMill and add the layers I need for the map. Each of the layers, including the coast shapefile, needed a custom projection. This is:
To run the Mapnik XML through Mapnik I used the following python code:
 That long-winded projection was needed again. Notice the coordinates in the drawMap function are OS coordinates, not longitude and latitude. Everything must match the chosen projection.
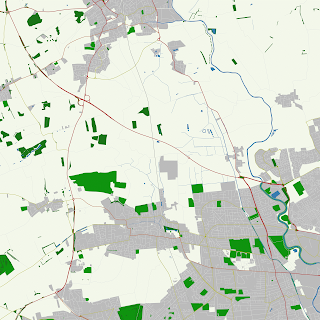
This gives me an image of the map in the OS projection, but the style could be any style you choose, though I'd be wary of copying the OS style too closely. This will now match the DEM data if they are combined. My style is still a bit stark and only renders a few objects, but it is something to work with.
Next I need to use it imaginatively.
The most detailed DEM data I have is based on Ordnance Survey OpenData, so creating a map in the OS projection will be useful. I use TileMill to create maps from OSM data.
Firstly I needed OSM data in the Ordnance Survey projection. That means loading some OSM data into a fresh PostgreSQL database. I created a PostgreSQL database and, as usual, add the extension for PostGIS. this creates a table called spacial_ref_sys that includes the OS projection, amongst many others. I often add the hstore extension too, but this is a simple map so I didn't need it.
createdb -E UTF8 EYOSI loaded an extract of OSM data using the usual osm2pgsql utility except the projection was needed too to convert the data to OS projection as it is loaded.
echo "CREATE EXTENSION postgis;" | psql -d EYOS
osm2pgsql --slim -d EYOS -C 1024 ey.osm.pbf --proj 27700I decided to add a coastline, so that needed to be in OS projection too. OSM coastlines are handled differently from all other data. They are extracted from the main DB, checked for consistency and created into a shapefile for the world. This is known as processed_p.shp. I have my own copy with a cut-down version with only the British Isles in it to make rendering a bit quicker. I reprojected that to a copy in OS projection using OGR2OGR, part of the Geospatial Data Abstraction Library.
ogr2ogr -t_srs 'EPSG:27700' -s_srs 'EPSG:3857' coast_bi_os.shp coast_bi.shp
Armed with all of this I could now start TileMill and add the layers I need for the map. Each of the layers, including the coast shapefile, needed a custom projection. This is:
+proj=tmerc +lat_0=49 +lon_0=-2 +k=0.999601 +x_0=400000 +y_0=-100000 +ellps=airy +units=m +towgs84=446.448,-125.157,542.060,0.1502,0.2470,0.8421,-20.4894 +units=m +nodefsI got this from the PostgreSQL table postgis created above. Once I had designed the map as I wanted it I exported the Mapnik XML and ran it through Mapnik. I discovered that the Mapnik XML was not quite right. It needed to have the third line changed so the srs part matches the custom projection above. There doesn't seem to be a way to set this in TileMill, so a manual edit was needed.
To run the Mapnik XML through Mapnik I used the following python code:
#!/usr/bin/python
# generate a map image in OS projection epsg:27700
import mapnik
import sys, os
def drawMap(filename, west,south,east,north):
print(filename)
sz = 5000
ossrs = "+proj=tmerc +lat_0=49 +lon_0=-2 +k=0.9996012717 +x_0=400000 +y_0=-100000 +ellps=airy +towgs84=446.448,-125.157,542.06,0.1502,0.247,0.8421,-20.4894 +units=m +no_defs"
m = mapnik.Map(sz,sz,ossrs)
mapnik.load_map(m,"osproj.xml")
bbox = mapnik.Envelope(west,south,east,north)
m.zoom_to_box(bbox)
im = mapnik.Image(sz,sz)
mapnik.render(m, im)
view = im.view(0,0,sz,sz) # x,y,width,height
view.save(filename,'png')
if __name__ == '__main__':
drawMap('cott.png',500000,430000,510000,440000)
 That long-winded projection was needed again. Notice the coordinates in the drawMap function are OS coordinates, not longitude and latitude. Everything must match the chosen projection.
This gives me an image of the map in the OS projection, but the style could be any style you choose, though I'd be wary of copying the OS style too closely. This will now match the DEM data if they are combined. My style is still a bit stark and only renders a few objects, but it is something to work with.
Next I need to use it imaginatively.
Friday, 8 May 2015
Heights
I've been working on something locally for a while that benefits from maps. It needs height information displayed so I thought I'd take a closer look at what was available, especially Digital Elevation Model (DEM) data
OSM doesn't hold much height information, so when people want to display heights they turn to outside information. One such source is Shuttle Radar Topography Mission data or SRTM. One Space Shuttle mission flew around the world and mapped the heights of the ground below using radar. This data has been published as open data. It is 1 second of arc data points for the USA and 3 seconds of arc data points for the rest of the world. This gives a height data point about every 90m for the UK. There are issues with this data with some places having voids where the radar return didn't register. It is usual for people who use this with OSM to render this data as contour lines or as hill shading or both as a way of visualising the height. I thought I'd do some simple processing to be sure I understood the data format.
The SRTM is published as a 1° square. I read the height values and displayed them as a shade of green since human eyes can distinguish more share variations in green than any other colour. Any voids I show as black There were nine pixels in this square) and any value with a small negative value (small so not a void) I show as blue. There's a lot of interest in this which I'd not noticed looking at contours. The dark area top left is the Vale of York, the green area top centre is the bottom end of the Yorkshire Wolds You can just make out the Humber estuary just above the centre and to the right. The bright green area bottom right is part of the Lincolnshire Wolds. The valleys with tributaries feeding into the Vale of York are interesting. None of those exist as rivers or streams today, so I expect they are remnants of the retreating ice caps about ten thousand years ago when the ground was still permafrost so any melting water cut river channels. Today the water table is much lower with the chalk of the Wolds allowing water to drain into it.
Next I looked at Ordnance Survey (OS) OpenData. They release height data as contours and spot heights in shape file format and DEM data too. The DEM is 50m spacing and should be free of voids. They use their own projection (EPSG:27700) for all of their data and this works better for the UK for some jobs. OS release some of their data in parcels based on their own grid. I am interested in a section of including Cottingham, a large village west of Hull. The OS square TA03 has Cottingham in the middle of it, so that is helpful.
I created a similar, image from the OS DEM data. I deliberately emphasised the height differences more than the SRTM image. The area is much smaller than the SRTM area but more detailed. bright green on the left is the edge of the Yorkshire Wolds. The blue line is the river Hull which cuts through the middle of the city of Hull. For comparison the bottom of the the blue smudge on the SRTM image is approximately where the OS image is. Again valleys are shown, though this time running west to east. Again they are dry (though very occasionally not which is part of what I'm investigating). I've decided that there is enough detail in the OS area and that it is big enough, perhaps with one more alongside it, to show what I want. so I'll work with that.
More of what to do with it later.
The python code to produce the SRTM image is here:
OSM doesn't hold much height information, so when people want to display heights they turn to outside information. One such source is Shuttle Radar Topography Mission data or SRTM. One Space Shuttle mission flew around the world and mapped the heights of the ground below using radar. This data has been published as open data. It is 1 second of arc data points for the USA and 3 seconds of arc data points for the rest of the world. This gives a height data point about every 90m for the UK. There are issues with this data with some places having voids where the radar return didn't register. It is usual for people who use this with OSM to render this data as contour lines or as hill shading or both as a way of visualising the height. I thought I'd do some simple processing to be sure I understood the data format.
 | |
| SRTM |
Next I looked at Ordnance Survey (OS) OpenData. They release height data as contours and spot heights in shape file format and DEM data too. The DEM is 50m spacing and should be free of voids. They use their own projection (EPSG:27700) for all of their data and this works better for the UK for some jobs. OS release some of their data in parcels based on their own grid. I am interested in a section of including Cottingham, a large village west of Hull. The OS square TA03 has Cottingham in the middle of it, so that is helpful.
 |
| OS TA03 square |
More of what to do with it later.
The python code to produce the SRTM image is here:
#!/usr/bin/env pythonThe code to produce the OS image is here:
# -*- coding: utf-8 -*-
import struct
from PIL import Image
def getpix(val):
if val == -32768:
return (0,0,0)
if val < 0:
return (0,0,255)
return (0,int(val),0)
if __name__ == "__main__":
top=54
left=5
highest=-5000
lowest=5000
tile = "N53W001.hgt"
#make the new empty (white) image
im = Image.new("RGB", (1201, 1201), "white")
with open(tile, "rb") as f:
#print get_sample(tile, n, e)
# scan through each of the heights in the file and colour a pixel
for n in range(1201):
for e in range(1201):
buf = f.read(2)
hite=struct.unpack('>h', buf)
#print '{0} {1} {2}'.format(n,e,hite[0])
pt=hite[0]
if pt == -32768:
print 'VOID {0} {1} {2}'.format(n,e,pt)
if ptlowest=pt
if pt>highest:
highest=pt
im.putpixel((e,n),getpix(pt))
print 'lowest:{0}, highest:{1}'.format(lowest,highest)
im.save('h.png')
#!/usr/bin/env python
# -*- coding: utf-8 -*-
import struct
from PIL import Image
def getpix(num):
val=round(num)
if val < 0:
return (0,0,255)
return (0,int(val)*3,0)
if __name__ == "__main__":
top=54
left=5
highest=-5000
lowest=5000
osf = "TA03.asc"
#make the new empty (white) image
im = Image.new("RGB", (200, 200), "white")
with open(osf, "rb") as f:
lines=f.readlines()
for i in range(5,205):
s=lines[i].split(' ')
for idx, val in enumerate(s):
im.putpixel((idx,i-5),getpix(float(val)))
im.save('o.png')
Monday, 16 February 2015
Drone deliveries
The US FAA has ruled that drones need to remain within sight of the operator. This is a major obstacle to companies planning deliveries in the US by drone. I had wondered what kind of mapping such an enterprise would need. Where would such a delivery be made? If the address has a garden then that might be useful, but what if there are plants or garden furniture in the way? If the address has a driveway then that could be a good landing site, but if the delivery sits on the driveway what's to stop it being stolen or driven over by car arriving? If the address is an apartment on a street front will the parcel just be dumped on the street? How could a drone safely land on a sidewalk?
When a delivery is made by hand it is handed over at a doorway, posted into a mailbox or left by a thinking person in a suitable place. A person can gain access to places like a shared lobby too. Can a drone do any of this?
Maybe would-be delivery addresses need to designate a landing site for drones, maybe that would need signage and access restrictions and possibly even extra insurance.
The more I think about it the mapping needed to control this would be very detailed and very specific. I suspect that the FAA ruling is the least of the problems this idea has.
When a delivery is made by hand it is handed over at a doorway, posted into a mailbox or left by a thinking person in a suitable place. A person can gain access to places like a shared lobby too. Can a drone do any of this?
Maybe would-be delivery addresses need to designate a landing site for drones, maybe that would need signage and access restrictions and possibly even extra insurance.
The more I think about it the mapping needed to control this would be very detailed and very specific. I suspect that the FAA ruling is the least of the problems this idea has.
Saturday, 29 November 2014
Save a village
I've been checking out a few new roads in the area. That took me to North Ferriby, a place I know well as I lived there for many years. A housing development, known as Melton Fields, was proposed about three years ago for a piece of land that is not actually in Ferriby, but in the next-door parish of Welton. The land is next to a wood in an open field and the developers dared to suggest that a footpath and cycleway would connect the development to Ferriby through the wood, as well as by a road joined into a recently modified junction - modified with this purpose in mind in my opinion. The development caused outrage that the extra people would swamp the village services and destroy the character of the village.
Three years on and the planning application has been turned down by the local authority and there's an enquiry under way. Enquiries like this seem pointless to me, everyone knows the dice is heavily loaded in favour of the developers, so why waste millions on an enquiry that will ultimately allow the development to go ahead anyway? We need new houses.

The one thing I have noticed over the past few years is the number of very ugly signs scattered all over the village, protesting about the development. This ugliness is something the village should be saved from - it is a real mess. I wonder if the owners of these signs got planning permission to erect the signs as they don't seem temporary to me. It is interesting that some recent developments in the village have these signs outside their properties (the one pictured is not a recent development). So squeezing poky little in-fills in that don't match the surroundings and all strain the services is OK but building an integrated new development outside of the village, which includes extra services is not. Save the village, but from nimbys not sensible development.
Three years on and the planning application has been turned down by the local authority and there's an enquiry under way. Enquiries like this seem pointless to me, everyone knows the dice is heavily loaded in favour of the developers, so why waste millions on an enquiry that will ultimately allow the development to go ahead anyway? We need new houses.
The one thing I have noticed over the past few years is the number of very ugly signs scattered all over the village, protesting about the development. This ugliness is something the village should be saved from - it is a real mess. I wonder if the owners of these signs got planning permission to erect the signs as they don't seem temporary to me. It is interesting that some recent developments in the village have these signs outside their properties (the one pictured is not a recent development). So squeezing poky little in-fills in that don't match the surroundings and all strain the services is OK but building an integrated new development outside of the village, which includes extra services is not. Save the village, but from nimbys not sensible development.
Subscribe to:
Posts (Atom)