 |
| Fungus Auricularia auricula-judae |
Monday, 30 April 2012
Fungus
Friday, 20 April 2012
With a bit of style
I have been working a little on a style in TileMill, using my laptop. The screen is 1366 x 768, so squeezing the display in is a nuisance. The TileMill page would be a bit better if the two main panes were able to be sized. The 1366 x 768 screen is now the most common screen size for a PC, so support could be better, maybe a tabbed layout might be better. The documentation is a bit sparse, but I have found my way around without too much hassle. Downloading the osm-bright example helped a lot. It is by far the easiest way to I have found to create a Mapnik style.
TileMill uses Mapnik to render the images and so Mapnik2 was installed as part of TileMill. I installed python-mapnik so I could run Mapnik stand-alone from a python script. TileMill offers to export the Mapnik style and I used that to make an image file.
Well, it should work, and it did. It was simple to do and I now have a style that I can use in Mapnik to render various places with my own style.
Now I can work on the style confident it will work.
Sunday, 15 April 2012
Blending your interests
OpenStreetMap has been interesting to me ever since I discovered it. It has led me to new and interesting places, many have been close to home. Like photography it crosses over with other interests, so when you visit somewhere you can map it too. I have added a few nature reserves as I have visited them, but usually mostly in outline, often based on the blend of some photos from a visit and some aerial imagery. The latest Bing aerial imagery makes it easy to mark the boundaries that are obvious.
Across the UK there are wildlife trusts, often each based in a single county. I've been a member of the Yorkshire Wildlife Trust for many years, and I've enjoyed their reserves both old and new, some of which are quite close to my home. I looked recently at their website and realized that their maps include an OSM layer, and naturally the reserves I've added show up there nicely. I say nicely - I actually don't like the way the Standard OSM layer renders them, with 'NR' sprinkled across them. That seems horribly English-centric and some transparent symbol or just a coloured background would be better, after all the name of the reserve will be rendered if possible.
I contacted YWT to say how I liked their use of OSM and was there any way we could work together to make sure all of their reserves appear on OSM. I hope that if we can add them all they would stop showing the Google layer, though an aerial view is useful. I know they need to add OSM attribution too, but I'm sure we can soon work that out.
A reply came back quickly saying they would like to work together and after some discussion we agreed to improve a local reserve on OSM to include as much detail as possible to see if we could not only make OSM better but use the data to perhaps make a purpose-made render for them to use elsewhere.
I have been out today surveying. I did get side-tracked into watching the avocets dancing and calling, but I gathered some useful details too.
A couple of features have made me stop and think. Firstly, there are often rafts in pools and lakes at nature reserves where birds can build nests, gulls and terns use them particularly. They are permanent enough to tag them, but how? I used man_made=pier, pier=nesting_raft for now, but someone might have a better suggestion. The other, slightly less specialist feature, is a mound or embankment. There is a footpath to a hide which lies between two embankments to keep people on the path from being seen by the wildlife and causing disturbance. If the path was on top of an embankment I would just add embankment=yes to the way for the path. If it was in a cutting I could add cutting=yes. I settled on drawing an outline of the embankment from imagery and using the tag man_made=embankment. It won't render on the Standard render, but that's not too important. There is another such mound, but this time for birds to burrow into for nests. I used the same idea to tag it. Rabbits seem to have taken it over.
My next job is to create a custom render for the reserve to see what is possible and I'm going to experiment with TileMill to see what I can produce. In the meantime you can see the latest render of the reserve here.
Across the UK there are wildlife trusts, often each based in a single county. I've been a member of the Yorkshire Wildlife Trust for many years, and I've enjoyed their reserves both old and new, some of which are quite close to my home. I looked recently at their website and realized that their maps include an OSM layer, and naturally the reserves I've added show up there nicely. I say nicely - I actually don't like the way the Standard OSM layer renders them, with 'NR' sprinkled across them. That seems horribly English-centric and some transparent symbol or just a coloured background would be better, after all the name of the reserve will be rendered if possible.
I contacted YWT to say how I liked their use of OSM and was there any way we could work together to make sure all of their reserves appear on OSM. I hope that if we can add them all they would stop showing the Google layer, though an aerial view is useful. I know they need to add OSM attribution too, but I'm sure we can soon work that out.
A reply came back quickly saying they would like to work together and after some discussion we agreed to improve a local reserve on OSM to include as much detail as possible to see if we could not only make OSM better but use the data to perhaps make a purpose-made render for them to use elsewhere.
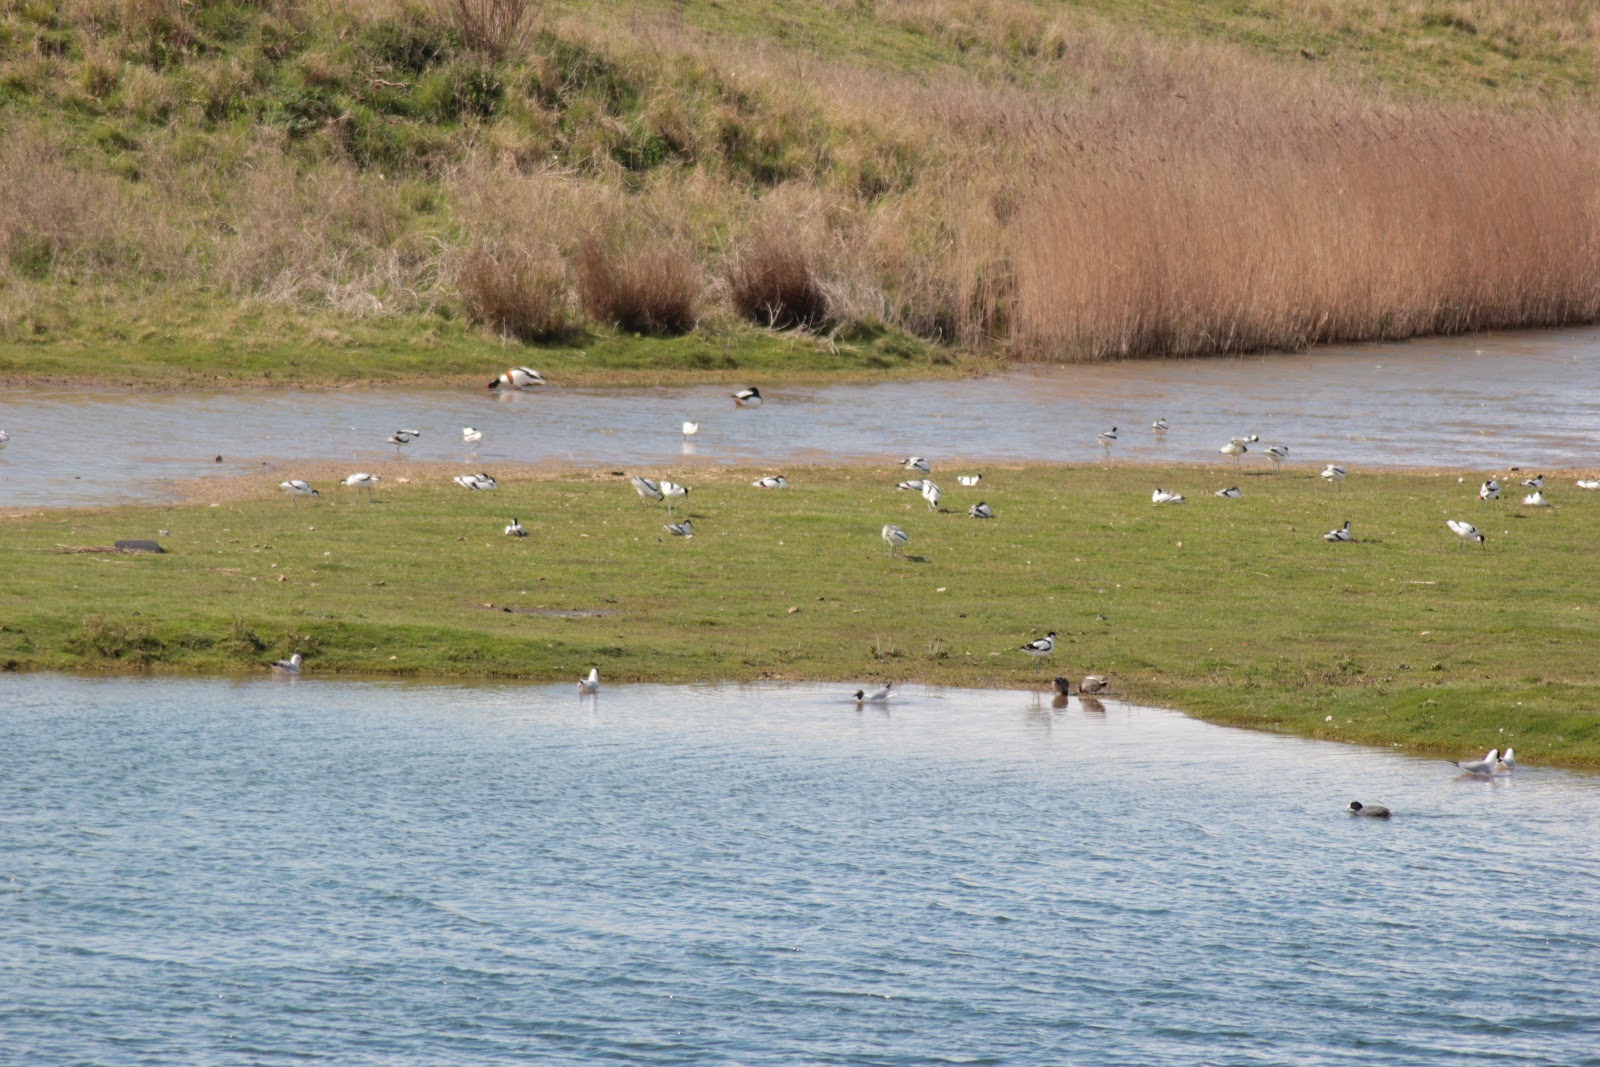 |
| Avocets |
 |
| A mound for nesting birds |
My next job is to create a custom render for the reserve to see what is possible and I'm going to experiment with TileMill to see what I can produce. In the meantime you can see the latest render of the reserve here.
Wednesday, 11 April 2012
Opening up Government
My postcode finder app has appeared on the data.gov.uk website which is titled Opening up Government. The page is here http://data.gov.uk/apps/chris-hill. The only other OpenStreetMap app there seems to be Cycylestreets, so I'm in good company, but room for more neighbours.
I'm not sure about the site's title. Not so much opening up government, more releasing public data to get it used in new and imaginative ways. In my case turning dry lists of postcodes into something useful and visual.
I'm not sure about the site's title. Not so much opening up government, more releasing public data to get it used in new and imaginative ways. In my case turning dry lists of postcodes into something useful and visual.
Tuesday, 3 April 2012
TileMill coast
While the OSM DB server is being upgraded and the data cannot be updated I thought I'd look at rendering. I've used Mapnik to do some rendering in the past. It is powerful, fast and uses the Anti-grain Geometry C++ templates which produce lovely sub-pixel rendering for clear thin lines, good colour contrasts and good quality curves and diagonals. The downside of Mapnik is its style sheets, which I don't think too many people get to grips with.
Recently I heard about TileMill so I thought I'd take a look. It installed very easily on my laptop running Ubuntu. A quick look at the results shows it is running node.js on my machine to provide the user interface through my browser. That works well and gives a slick and responsive interface. It also installed Mapnik, which is what renders the maps. TileMill can use various data sources such as shapefiles, GeoJSON, GeoTIFF and PostGIS. I already run PostGIS with some data imports for the existing rendering, so that was a place to start. This is data imported into tables in a way that makes rendering easier. I have just copied the data in the way the Standard map view on the OSM site uses it. This does not include all data from OSM for a selected area, only the data that the Mapnik style is set up to render.
When I created a new TileMill project it started by creating a layer to show the outline of the landmasses. I quickly zoomed in to see my local area. The coastline showed up the Humber Estuary and, as it should, it stopped abruptly at about the place the Humber bridge crosses. Beyond that it is not officially coastline but river. I have not yet imported any other data to show up the rest of the river system.
The first thing I tried to add were a few roads. Copying an example I created a layer that loaded some data from planet_osm_line, the dataset in the PostGIS db that holds an extract of linear things like roads. TileMill uses a language they call Carto to describe the selection and style of the objects to be displayed on the map. It is a lot like CSS. I copied a small piece of Carto code and on saving the code the map quickly redrew with some thin grey lines to show some roads. That was very satisfying. A few more lines of code and more road types appeared in various colours and thicknesses. Then I noticed a problem.
The coastline was rather crude and some roads strayed into the sea. I realised that what I needed was the OSM coastline to exactly match my OSM data. I looked around and found the processed_p shapefile which is a detailed OSM coastline. It was nearly 500MB uncompressed, but as I only want to work with GB data at the moment I loaded it into Quantum GIS and extracted the GB part and saved that separately as a shapefile. Once that shapefile was loaded as a layer in TileMill the detail jumped out and none of the roads were submerged any more. If you are interested in Birmingham none of this would matter. There may yet turn out to be a better way of using processed_p or some similar coastline.
I have a lot to look at yet but it is an interesting start. I want to be able to render an area as tiles to use in my own way with my own style and this looks very promising.
Subscribe to:
Posts (Atom)