I've been working on a project in the City of Hull. Part of that needs to find a specific road in the city. I wanted to use a type-ahead style search, showing a list of roads that meet a partial match of whatever is typed - a fairly normal modern requirement. In OSM we have the Nominatim search, but it is intended for searching the World - my requirements are more modest.
I extracted a list of road names from an OSM extract for Hull to take a look at. The first hassle is that there seemed to be loads and loads of duplicates. These mostly turn out to be roads that have small spurs with the same name and small 'T' or 'Y' endings of dead ends which again get tagged with the road name. The next next hassle is that I need to be able to zoom a map to show the selected road, so I thought I needed to know the centre point of each road. I thought about creating a bounding rectangle for the road and then calculating the centre point. Suddenly that rang a bell.
That format is what the open data OS Locator is presented as. So I decided to see what was needed to use that. First I extracted the roads for Hull from the GB dataset, converting the OSGB grid references to longitude and latitude in the OSM projection. There were a few duplicate road names. OS break a road at an administrative boundary, so as a road crosses a ward boundary it is split. There were about 160 of these (a tiny fraction of the OSM duplicate names) which I recombined into a single rectangle and recalculated the centre point.
One thing I know about in OS Locator data is that there are mistakes. Having surveyed all of Hull and recorded the anomalies with the not:name tags I could use these to correct the OS Locator data to reflect the names on the ground. I then changed the OS names to title case (lowercase with capitalised names) and removed apostrophes which would make searching harder. I then added all these roads with their centre points, about 2700, into a database table. Python scripts made short work of all of this.
I wrote a quick couple of lookups to make the jQuery ajax type ahead work, one returns the list of matches of road names based on a search term and one returns the details for a specific named road. I used the longitude and latitude of the centre point to zoom to that location on the map. Quickly I realised that didn't work well for all roads, because the zoom level needed to vary to show the whole road, some are much longer than others. Fortunately the OS Locator data holds the rectangle that encloses the road, so I zoomed the map to the maximum zoom that shows that rectangle. The Leaflet library makes all of this pretty simple.
You can see an example of the end result here. I chose the Mapquest Open tiles because they will suit another part of the project, more of that another time ...
Friday, 28 December 2012
Thursday, 15 November 2012
St Nicholas gate
Beverley, in East Yorkshire, is a market town, which like many others, feels like it is all jammed into a small space. It has expanded into two adjoining villages, Molescroft and Woodmansey but the space within Beverley is still at a premium. The town has had industry in the past, especially a large tannery and I expect the good people of the town are now probably happier not to have the place as the smell was awful. The site became a museum for a while but for some years it has lain as rubble strewn waste ground. Now a new housing development has started and the first houses are complete.
I have been biding my time, waiting for access before I surveyed the roads. When the latest OS Locator comparisons highlighted three of the roads as missing from OSM I decided it must be time to take a look. One road, Simmonds Close, is quite conventional, but the other two are a little different. The front door of these houses face onto a short pedestrian road with a service road behind each one with garages and access to the rear of the houses. I wandered up each road, GPS in hand and chatted to the builders who were finishing some of the houses off, then went on my way.
When I got home I discovered that OS Locator has labelled the service roads as the missing roads (Hamilton Walk and Dickinson Walk). I suspect the clue is the name guys, the walking bits are the named roads, not the service roads.
 There was a good view of Beverley Minster from the end of one road.
I have been biding my time, waiting for access before I surveyed the roads. When the latest OS Locator comparisons highlighted three of the roads as missing from OSM I decided it must be time to take a look. One road, Simmonds Close, is quite conventional, but the other two are a little different. The front door of these houses face onto a short pedestrian road with a service road behind each one with garages and access to the rear of the houses. I wandered up each road, GPS in hand and chatted to the builders who were finishing some of the houses off, then went on my way.
When I got home I discovered that OS Locator has labelled the service roads as the missing roads (Hamilton Walk and Dickinson Walk). I suspect the clue is the name guys, the walking bits are the named roads, not the service roads.

Tuesday, 13 November 2012
OS Opendata in OSM
Prompted by a comment from Socks, I have looked at some of the GB regions where Ordnance Survey road names don't match the names in OSM. The OS Opendata names on roads are provided by OS StreetView and a textual version is provided by OS Locator. ITO World and Musical Chairs both use OS Locator to create a graphical tool to help people identify where the OS & OSM names for roads differ.
Sometimes the name OS has for a road does not match the name displayed on a name board for the road. OSM uses the name from the name board. To help with the processing of anomalies the wrong, OS name can be added as a not:name tag. The occurrence of the not:name tag is a useful indicator to the origin of the names in OSM. If the names closely match the OS list then the OS names may have been used and the actual names may not have been surveyed. In this way the errors in the OS datasets find their way in to OSM.
One possibility is that mappers in an area may not use the not:name tag. They may not like it or maybe they don't know about it. If they survey their road names and don't use the erroneous OS names then these anomalies should show up in any comparison.
I looked at some of the data about OS Locator and threw some data into a list for the most complete 250 authorities. ( I lost the will to live after 250.) You can see the list at osloclist.raggedred.net. If you click the headings it will sort that column, allowing you to see where how each authority compare.
Friday, 9 November 2012
Short cuts
The latest version of OS Locator open data has been released. Musical Chairs and ITOWorld both published updated information. There are five new names in Hull and seventeen in East Yorkshire all to be visited, checked and then updated.
Of course there is a short cut. I could just use the names OS supply and update the roads in OSM without checking. That would be easy, I could do it from home without spending any time out in the cold and the city and county would quickly look complete again. I could get most of this from the OS StreetView, copying the road names from the tiles overlaid in the editors. Would that be a good idea?
I have checked some of the areas that have slowly had the number of anomalies whittled away and it seems that about 3½ to 4% of the roads named get a not:name tag to show that what is shown on the ground is not the name OS think it is. So if I just copied the OS names without checking them I would be introducing about a 4% error into the names in OSM.
Looking at a few places where the names have suddenly had a huge reduction in the list of anomalies it seems that the checking may not have been done. Sheffield has a not:name ration of 0.5%, Penwith has a ratio of 0.9%. Taunton Dean has no not:names at all. It is possible that this ratio is right, but it seems unlikely. I hope that people do manage to sort this out over time, but a road with a name is not likely to have its name resurveyed, so I suspect most of these will persist.
I like the OS Locator data and I'm grateful to the people who process it and make it available to mappers. It is a great way to find out the roads that have been added or changed recently (thanks OS) but please use OS (or any other data) sceptically, it is not perfect, it needs checking. Short cuts are only useful if they preserve the quality.
Tuesday, 30 October 2012
Office of National Statistics
The UK Office of National Statistics announced they have released some OpenData under the Open Government Licence. This is all based around GB postcodes, excluding Northern Ireland.
Edit: Postcodes for Northern Ireland (BT codes) are included. They are based on the Irish National Grid and need to be transformed to the projection OSM uses with the EPSG geodetic parameter EPSG:29902; OSGB needs EPSG: 27700.
I downloaded the data as a CSV and checked what the format looked like. A quick Python script using the proj4 extension for Python and the OSGB northings and eastings turned into longitude and latitude. Checking for expired postcodes and missing northings and eastings and I had a set of data in the same format as my existing CodePoint Open data. I reused the tile rendering process that I'd used with the CodePoint Data. So now I have GB postcode tiles based on Open Government Licenced data to use as an overlay on JOSM and Potlatch2. They work as an overlay on Leaflet or OpenLayer too. There's some information here, including an overlay. So now I have GB postcode tiles based on Open Government Licence data to use.
The work I put in to get permission to use the CodePoint Open data from Royal Mail seems to have been ignored by the Licence Working Group. I passed the written permission on to them so they could remove the statement excluding the CodePoint Open data on the OS OpenData page. When I removed the statement it was quickly reverted by the guy who caused the phoney fuss about the OS OpenData licence in the first place. Rather than start an edit war I asked the LWG to make the change, but that seems to have been too difficult for them to do, as does answering my emails.
Still, now UK postcodes are available and I hope people will find them useful and uncontroversial.
Sunday, 14 October 2012
GeoJSON conversions
Looking some more at converting route relations into GeoJSON it quickly became clear that some options are less useful than others. One thing that causes problems are braids. A braid is where a route splits into two alternate routes. I thought about this in advance and didn't think they would be much of a problem, but I was wrong. If a route is a two-way route where you could travel along it in either direction there are braids more often than I expected. Dual carriageways immediately cause problems as the route would take separate carriageways depending on the direction. Roundabouts with flares similarly have alternate routes depending on direction and a few complex junctions also have alternative routes too. One-way systems in a town also forces different routes to be used. Then there are the genuine alternative routes giving an option such as a picturesque versus quicker route.
My original plan was to try to create a single GeoJSON LineString to represent the whole route. This is clearly not possible as each braid cannot fit into a single LineString and braids are the norm not the exception. Another way is to treat each way in the OSM relation as a separate GeoJSON LineString.
GeoJSON can have a single object in it or multiple objects. Each object can also be a multiple object in itself. A LineString has a single line, a MultiLineString has multiple lines, but, confusingly, a MultiLineString counts as a single object. Each single object is a feature and GeoJSON can hold a collection of features, known as a FeatureCollection. These can be mixed types of points, lines and polygons, though for now I'm only interested in lines. If an object is described as a feature, the feature can also have properties, indeed it must have properties.
I'm going to experiment with the options and see what works.
Saturday, 13 October 2012
Basic mapping
Talking today to our local parish council chairman, Geoff, while we both tidied our allotments, I discovered that he has been using OpenStreetMap map of the village to look up where planning applications in the village apply to. Adding all of the buildings and addresses in the village certainly helps him, which is great.

There has been some talk about changing the style of the OSM home page and the map that gets presented there. I'm not sure the home page should be filled with a map - I think it sends the wrong message. We should provide renders certainly, but maybe a few shown with thumbnails rather than the drop-down menu on the home page. That menu, and the other changes to the style, are better than the plain OpenLayers style that was there before. Thanks, I think, to Tom MacWright for those changes. The problem is that maps mean different things to different people. Some people see the house address numbers and names as clutter, whereas Geoff clearly finds them useful. Some people want to see more points of interest, others see too many shops, postboxes, businesses and so on as clutter. Too many points of interest mean there is not enough room to write all of their names so detail is not shown. Some people want to see routes, such as bus routes, or cycle routes others want to see clearly named roads, not covered by routes they don't use. Some people like boundaries to be drawn, others are confused by these lines appearing that they don't understand. Some people would like contours or hill shading, others think it gets in the way.
I'm up for a change - it seems overdue to me. It is clear that a single map can't be useful to everyone, and that many maps will still fall short for many people. There will continue to be specialist maps and specialist overlays, but it seems that a map to provide most power for OSM should be simple, with little detail beyond features like waterways, roads, railways and place outlines. This can then be used with a series of overlays that can be selected to supply the user with what is required. A simple base map would also be very useful for other people's specialist overlays too. I'd like to see thumbnail maps of various types on the OSM landing page so a detailed map is never more than a click away which can then be bookmarked for later use.
If the base map is changed, people like Geoff need to find their overlay ('Buildings with Addresses' for example) as easily as possible and it needs to be easy to bookmark so he can find it again next time.
I don't know if this is possible - the simple base map sounds possible, until you think of the email threads that will ensue about what should or should not be included. The overlays will each need to either be created on the fly or re-rendered as the objects they show get changed, in much the same way as map tiles get rendered now when something changes. Does OSM have the resources to deliver this?
I'm really interested to see what happens, I just hope the debate can be positive, productive and open.
Tuesday, 9 October 2012
GeoJSON from Relations
I've been working on a couple of small projects and both need overlays on maps. Using the lovely LeafletJS library overlays as points, lines and polygons are easy if your overlay comes as GeoJSON. I often store the data in a database and generate the GeoJSON on the fly to download to the overlay using Ajax. The issue sometimes can be where to get the data from to create the overlay and how then to store it in the database in the best way to create the dynamic download.
I have written some bespoke scripts for each situation so far so I thought I'd see how easy it would be be to write something a bit more general. My first thought was how to make a GeoJSON file that describes a route from a relation. Often route relations are in OSM data but they don't render on the Standard render. These routes might be commuter or tourist cycle routes, long-distance walks, tourist walks in a city, bus routes and so on. A series of overlays would then allow these to be selectively displayed.
To create a simple GeoJSON overlay for a route I could create a LineString feature. That needs a series of points with latitude and longitude for each point in the correct order to draw the whole route. These come from the nodes in the ways in the relation. The nodes in each way can be listed in either direction along the way, depending on how it was drawn. The nodes that make the join between the ways will appear in the two joining ways.
Another way would be to create a MultiLineString feature. This could be made of each way that makes up the relation, so each point in each LineString is simply a node along the corresponding way. The duplicate nodes that join two ways just make the two LineStrings join up. The direction each LineString is drawn does not matter to the way it looks. Using these for simple overlays would also allow only some of the LineStrings to be used for a limited area. This is simpler, but it might not be what is sometimes needed. One big disadvantage is that if the overlay is drawn with a transparent line, where two lines overlap at the joining node the doubled-up more opaque colour will be obvious.
The ideal route relation would only have ways in it. If there are nodes in the relation they can easily be ignored, but there is the case of super relations, where a long or complex route relation might be made of other, smaller relations. I'm going to ignore that for now. The ideal route relation would have a series of ways listed in the relation so that each follows the other correctly. This is where the whole process breaks down most often. Ways in relations are often out of sequence. Often one ways leads directly into the end of another, but sometimes that is not so. A tee junction in OSM is entirely normal, but when a route takes the tee, the way may not be broken at the junction so a spur continues past the junction. These really ought to be fixed, but in reality not all have been. In city centres with a variety of bus routes and cycles routes the streets can get broken into many small sections in a few places and just occasionally someone who doesn't spot or understand the relations may try to 'mend' the ways either breaking the relations or leaving these spurs as they go. There may also be gaps in the route. Then there are roundabouts. They are closed so there is no way to join one end of that to the end of another way. Some routes have one-way sections too.
I need to work out the best way to deal with these anomalies. I'm hopeful the result will be useful. Then I need to work out the best way to store GeoJSON in databases such as MySQL and SQLite to then be useful.
Saturday, 6 October 2012
More local cycle routes
After looking at the routing of NCN 1 yesterday, I thought I'd check out the braids of NCN 65 today. When something is on your doorstep and you know it well it is easy to ignore the signage, but today I put myself in the shoes of a visitor trying to follow the National Cycle Network route 65 in my local area.
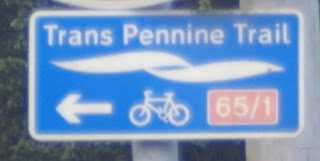
Firstly I hope such a visitor would have a lovely map based on OSM or a GPS route based on OSM because then they would make sense of the route without looking at the signs. Along the route it is generally signed well, but at a couple of important decision points the signs could be better. The section of the NCN 65 I'm interested in here is also shared with the Trans Pennine Trail. You can see it here on Andy Allan's lovely cycle map. The route, travelling west to east enters North Ferriby and arrives at the crossroads, as shown in more detail from Andy's map here:

As you approach from the west you can see this sign:

The sign seems to say that the NCN 65 turns left (along Swanland Hill) and local cycle route turns right (along Church Road). This is actually where the two braids of NCN 65 split up, but the sign doesn't make it clear that route 65 could be either way.
If you do turn left you are taking a longer braid that goes through the villages, the shorter, flatter route is to the right and follows the Humber bank to Hessle. Both routes are fairly well signed along their length and I think I could find my way just following the signs, but you might be confused if you did turn right to find you are still following NCN 65.
 Suppose you are travelling east to west and you have followed either braid to this point you want to be sure you turn west along High Street to continue correctly and in both cases there is a sign to help.
But look again, where did that '/1' come from on the second sign? This shows that if you are travelling north up Church Road and you turn left you will be on NCN 65 (correctly) and also on NCN 1. NCN 1 is not on that road and if you head left you will be heading away from the nearest point of NCN, which is in Hessle where you just came from if you are following NCN 65, and you will not meet NCN 1 until you have circumnavigated the world.
So what about the other point at which the route diverges into braids? That is in Hessle as Andy's map shows:

The route from the east divides at the junction of First Lane and Hull Road. If I am travelling west the sign one sees is this (sorry for the photo):
 This shows the route north, through the villages is NCN 65 and the route west appears to be a local cycle route to (along?) the Humber bank. Again if you travel straight on here you be surprised to find you are still on NCN 65, which is well signed. If you arrive at the junction from the west a sign clearly points you to carry on eastwards as expected (no photo available) if you arrive along the braid through the villages south down First Lane you are greeted by a this sign:
 This is informative, but slightly confusing. If you are following the whole route and chose the villages braid you need to turn left to continue, if you turn right you will return to North Ferriby where you made the choice by the Humber bank route. Since both are labelled 65 this is not entirely clear.

 There are other anomalies along the route. Where NCN 1 joins with the Humber bank braid there is a sign showing the route 65 in brackets, it is not in brackets anywhere else that I have seen. About four kilometres away in North Ferriby the signs that show 65/1 are repeated, even though this is certainly not NCN 1 and the newer sign in the opposite direction has this right.
As I mentioned in my last post, Sustrans want to change the braids to make them uniquely numbered or named. That is a good idea, but will mean changes to some signage and especially at the places braid join up.
As usual a trip out even to a very local area revealed something I had missed before and I have added the name to a very small park at the point in North Ferriby that the braid join.
Maps on this post are © openstreetmap contributors for the data; the map tiles are by Andy Allan.
Firstly I hope such a visitor would have a lovely map based on OSM or a GPS route based on OSM because then they would make sense of the route without looking at the signs. Along the route it is generally signed well, but at a couple of important decision points the signs could be better. The section of the NCN 65 I'm interested in here is also shared with the Trans Pennine Trail. You can see it here on Andy Allan's lovely cycle map. The route, travelling west to east enters North Ferriby and arrives at the crossroads, as shown in more detail from Andy's map here:
As you approach from the west you can see this sign:

The sign seems to say that the NCN 65 turns left (along Swanland Hill) and local cycle route turns right (along Church Road). This is actually where the two braids of NCN 65 split up, but the sign doesn't make it clear that route 65 could be either way.
If you do turn left you are taking a longer braid that goes through the villages, the shorter, flatter route is to the right and follows the Humber bank to Hessle. Both routes are fairly well signed along their length and I think I could find my way just following the signs, but you might be confused if you did turn right to find you are still following NCN 65.
 Suppose you are travelling east to west and you have followed either braid to this point you want to be sure you turn west along High Street to continue correctly and in both cases there is a sign to help.
 But look again, where did that '/1' come from on the second sign? This shows that if you are travelling north up Church Road and you turn left you will be on NCN 65 (correctly) and also on NCN 1. NCN 1 is not on that road and if you head left you will be heading away from the nearest point of NCN, which is in Hessle where you just came from if you are following NCN 65, and you will not meet NCN 1 until you have circumnavigated the world.
So what about the other point at which the route diverges into braids? That is in Hessle as Andy's map shows:
The route from the east divides at the junction of First Lane and Hull Road. If I am travelling west the sign one sees is this (sorry for the photo):


 There are other anomalies along the route. Where NCN 1 joins with the Humber bank braid there is a sign showing the route 65 in brackets, it is not in brackets anywhere else that I have seen. About four kilometres away in North Ferriby the signs that show 65/1 are repeated, even though this is certainly not NCN 1 and the newer sign in the opposite direction has this right.
As I mentioned in my last post, Sustrans want to change the braids to make them uniquely numbered or named. That is a good idea, but will mean changes to some signage and especially at the places braid join up.
As usual a trip out even to a very local area revealed something I had missed before and I have added the name to a very small park at the point in North Ferriby that the braid join.
Maps on this post are © openstreetmap contributors for the data; the map tiles are by Andy Allan.
Friday, 5 October 2012
Cycle data and cycle routes
Not long after I started adding to OpenStreetMap I added some of the local Cycle network. Sustrans is a charity that has grown to encourage safe cycling in the UK and part of that is to specify routes that people might like to follow on a bike. Some of it is off-road, some on cycleways beside roads and some are on roads. Sometimes these roads have cycle lanes, sometimes not. Sustrans works with local authorities to put up the signage for the routes along roads and has volunteers to help with the routes too.
Cyclestreets is a route planner for cyclists. It uses OpenStreetMap data and so getting OSM as accurate as possible is important to them, particularly regarding cycling infrastructure. They recently received some open data from the Department for Transport which we can compare to OSM and improve it where possible.
Andy Allan has modified the Potlatch 2 editor to create a version that assists with the process of adding useful stuff from the DfT data to OSM. You can see more here. I have used it to confirm that some of the routes in my area as well tagged, often adding a surface tag and lit tag to improve things. (Do we really need to tag surface=asphalt on most UK roads?) I then quickly noticed that something was odd - part of the NCN 1 relation was missing. I discovered that it had been removed as part of a rationalization of the NCN numbering at Sustrans.
Now, I like to survey what I add to OSM. On the ground there are signs for NCN 1 (and NCN 65 and the Trans-Pennine Trail) along the route that had been removed. After a discussion and a look at the Sustrans rule book it is clear that there is a problem.
Sometimes the Sustrans routes have alternatives. In this case there are two ways to to get from the Humber bridge at Hessle to Beverley, both following NCN 1. One route takes you into Hull and Cottingham and the other takes a more direct route through Kirk Ella to Cottingham and then both on to Beverley. This idea that two routes could both have the same number on the signs has always struck me as daft and confusing, possibly leading to a long detour by mistake (more later). It seems that Sustrans now agree and they are trying to sort it out either by making it clear that one is a loop, or alternate route or by renumbering one of the routes if they diverge for a long way. Sounds good, but on the ground none of the signs have changed yet here, so changing OSM to reflect the Sustrans policy does not help people trying to find the route on the ground. I'm not sure how we would stand with respect to Sustrans's copyright either. We clearly can't copy their maps, only glean what we know from surveys and local knowledge. Some Sustrans rangers are OSM contributors too, but not around here. They do have inside knowledge for their area. I have to stick to what I see on the ground.
When I first checked out the NCN 1 route through Kirk Ella I found it from a handful of signs, some of which have now been removed. I was dubious about it at the time - it involved using a very muddy bridleway and going through a school campus. It seems the signs have been removed because the route has been changed. We checked out the new route today. The signage is poor to say the least. The signs are stuck to the poles of road signs or lamp posts and some are peeling off. None are the flat metal or plastic signs that are used elsewhere and stand out so well. At a couple of junctions the signs are missing, so a left-or-right choice at a tee junction becomes a guessing game in the traffic. Overall the new route is fine - it just needs some more signs.
At the point the two routes join in Cottingham there is a much bigger problem and one that I suspect is why Sustrans want to eliminate multiple routes with the same number. The tile from Andy Allan's excellent cycle map shows the situation.

The two routes (in pink) converge along Northgate; the direct route east along Northgate and the route through Hull west along Northgate. Both should turn north along Park Lane. The problem is there are no signs to say so. So in either case the next sign a cyclist will see will be merrily guiding them back toward the point in Hessle they left many kilometres ago, and no way for him to know that from the signs. Signage is very important and seems to not be very good here. It is clear that the route numbers do need to be changed, but that must be reflected on the ground too. As a compromise I have broken the NCN 1 relation in OSM and shown the shorter route as an separate relation - I don't know if that is right yet, I hope Sustrans help me to get it right.
Then there is NCN 65 ...
Cyclestreets is a route planner for cyclists. It uses OpenStreetMap data and so getting OSM as accurate as possible is important to them, particularly regarding cycling infrastructure. They recently received some open data from the Department for Transport which we can compare to OSM and improve it where possible.
Andy Allan has modified the Potlatch 2 editor to create a version that assists with the process of adding useful stuff from the DfT data to OSM. You can see more here. I have used it to confirm that some of the routes in my area as well tagged, often adding a surface tag and lit tag to improve things. (Do we really need to tag surface=asphalt on most UK roads?) I then quickly noticed that something was odd - part of the NCN 1 relation was missing. I discovered that it had been removed as part of a rationalization of the NCN numbering at Sustrans.
Now, I like to survey what I add to OSM. On the ground there are signs for NCN 1 (and NCN 65 and the Trans-Pennine Trail) along the route that had been removed. After a discussion and a look at the Sustrans rule book it is clear that there is a problem.
Sometimes the Sustrans routes have alternatives. In this case there are two ways to to get from the Humber bridge at Hessle to Beverley, both following NCN 1. One route takes you into Hull and Cottingham and the other takes a more direct route through Kirk Ella to Cottingham and then both on to Beverley. This idea that two routes could both have the same number on the signs has always struck me as daft and confusing, possibly leading to a long detour by mistake (more later). It seems that Sustrans now agree and they are trying to sort it out either by making it clear that one is a loop, or alternate route or by renumbering one of the routes if they diverge for a long way. Sounds good, but on the ground none of the signs have changed yet here, so changing OSM to reflect the Sustrans policy does not help people trying to find the route on the ground. I'm not sure how we would stand with respect to Sustrans's copyright either. We clearly can't copy their maps, only glean what we know from surveys and local knowledge. Some Sustrans rangers are OSM contributors too, but not around here. They do have inside knowledge for their area. I have to stick to what I see on the ground.
When I first checked out the NCN 1 route through Kirk Ella I found it from a handful of signs, some of which have now been removed. I was dubious about it at the time - it involved using a very muddy bridleway and going through a school campus. It seems the signs have been removed because the route has been changed. We checked out the new route today. The signage is poor to say the least. The signs are stuck to the poles of road signs or lamp posts and some are peeling off. None are the flat metal or plastic signs that are used elsewhere and stand out so well. At a couple of junctions the signs are missing, so a left-or-right choice at a tee junction becomes a guessing game in the traffic. Overall the new route is fine - it just needs some more signs.
The two routes (in pink) converge along Northgate; the direct route east along Northgate and the route through Hull west along Northgate. Both should turn north along Park Lane. The problem is there are no signs to say so. So in either case the next sign a cyclist will see will be merrily guiding them back toward the point in Hessle they left many kilometres ago, and no way for him to know that from the signs. Signage is very important and seems to not be very good here. It is clear that the route numbers do need to be changed, but that must be reflected on the ground too. As a compromise I have broken the NCN 1 relation in OSM and shown the shorter route as an separate relation - I don't know if that is right yet, I hope Sustrans help me to get it right.
Then there is NCN 65 ...
Thursday, 27 September 2012
Small error
In my last post I made a mistake. The roads I thought I had added in the Hedon area were really in Preston. If you look at the map, you might see why I made the mistake. The boundary between the town of Hedon and the parish of Preston is clear and what looks like part of Hedon falls plainly into Preston. The quickest way to get to the rest of Preston is through Hedon.
Keeping it fun
A short trip out today to the east of Hull, into the area known as Holderness. We were looking to find some new developments in Keyingham, Thorngumbald and Hedon. The two in Keyingham and Thorngumbald were very similar and slightly unusual design of houses. They look to be by the same architect. The upper level only has skylights in the roof, but the eves are half a storey above where I'd expect them to be.
In Hedon the new road is part of a bigger development. The roads don't all have names yet, but I added them with a note anyway.
As usual, a survey turns up extra stuff. The extra roads, a new 20 mph speed limit, a playground both in Hedon and Keyingham, a recreation ground not added before and a hotel too.
I added the details I saw, tweaked a few roads to give a better alignment with Bing, now I have GPS tracks to confirm how well aligned Bing is and got tempted into adding a few buildings too.
There is a lot of discussion at the moment about the imported Cadastre data in France. I don't know how good the data is or how well it is being interpreted as it is imported (wall=no seems an odd tag for a building) but I'm glad that my contributions to OSM relies mostly on a trip out to see what is really there, backed up with imagery and OpenData. It is what makes OSM fun for me.
Thursday, 13 September 2012
OS and OSM road names
OS Locator is useful. As I have said before it helps OSM mappers in Great Britain find places where the names of roads we have mapped disagree with the names Ordnance Survey have. The reasons the names differ are many and vary across different types of road. Many country roads just don't have a name board, so if we use the OS name there can be no difference - except that the names on OS StreetView are sometimes different from the names on OS Locator. This might imply more errors being possible where all the roads are named. There are typographical differences such as names with or without a space (Tweendykes Lane vs Tween Dykes Lane) or use of apostrophes. Sometimes the name is just completely wrong. Just occasionally a road can have two or more name boards that do not agree, but I've only seen a small difference such as use or not of an apostrophe.
OS do not provide the definitive name, that is the local council that the road falls into. Where a road straddles two authorities this can cause a problem: a road called Endyke Lane in East Yorkshire turns into Endike Lane as it crosses into Hull, though now not exactly on the boundary.
I believe the name board on the ground to usually be correct, after all if the board was wrong people on that street are likely to ask questions of their council and it may well get changed.
I saw a comment earlier today on twitter from Tom Chance (@tom_chance) about the discrepancies in Southwark and they looked to be at a similar level to East Yorkshire and Hull that I have worked on. I thought I'd take a look, and ended up examining some some from the very useful ITOWorld OSM Analysis page. I took the twenty nine areas that were 100% complete and worked out the percentage of name anomalies for each area. The graph of the results is below:
 The average percentage of anomalies is 2.65%. The idea that there are no anomalies in Taunton Deane seems odd to me, though possible.
This looks like a spread of differences that might reflect the fact that different surveyor work in different areas and everyone makes mistakes. Has an OS surveyor misread or misrecorded or mistranscribed a name? I feel that many of the anomalies will have been rechecked on the ground by OSM surveyors, in case they were wrong, so in general I trust OSM more than OS. I hope that no one just uses the OS names in the belief they are always right. There is also a very small chance that both OS and OSM have misrecorded a name in the same way so they agree (no anomaly) but are both wrong.
OS do not provide the definitive name, that is the local council that the road falls into. Where a road straddles two authorities this can cause a problem: a road called Endyke Lane in East Yorkshire turns into Endike Lane as it crosses into Hull, though now not exactly on the boundary.
I believe the name board on the ground to usually be correct, after all if the board was wrong people on that street are likely to ask questions of their council and it may well get changed.
I saw a comment earlier today on twitter from Tom Chance (@tom_chance) about the discrepancies in Southwark and they looked to be at a similar level to East Yorkshire and Hull that I have worked on. I thought I'd take a look, and ended up examining some some from the very useful ITOWorld OSM Analysis page. I took the twenty nine areas that were 100% complete and worked out the percentage of name anomalies for each area. The graph of the results is below:

This looks like a spread of differences that might reflect the fact that different surveyor work in different areas and everyone makes mistakes. Has an OS surveyor misread or misrecorded or mistranscribed a name? I feel that many of the anomalies will have been rechecked on the ground by OSM surveyors, in case they were wrong, so in general I trust OSM more than OS. I hope that no one just uses the OS names in the belief they are always right. There is also a very small chance that both OS and OSM have misrecorded a name in the same way so they agree (no anomaly) but are both wrong.
Sunday, 9 September 2012
Thanks to Ordnance Survey
About two and a half years ago Ordnance Survey released their OpenData. It keeps getting updated so anything that uses it can be updated and improved too. The Code-Point Open data which includes GB postcodes (not postcodes for Northern Ireland) were updated in August so I reloaded them on my postcode overlay. You can see more here, including my postcode finder.
Another one of the OS OpenData datasets that I particularly like is OS Locator. This gives a bounding box for each named road in Great Britain. If these names are compared to the names in OSM the anomalies can be derived and then a survey shows where the name or the whole road is missing from OSM or where the name in OSM or the OS Locator data differs from what is on the ground. ITO World publish the list of anomalies, grouped by local authority. The thing I like best is that as new OS Locator data is published, new anomalies appear, particularly where new developments are taking place. In effect OS are helping keep OSM up-to-date by pointing where new roads are being built. I use the map tiles ITO provide to show unresolved anomalies as an overlay on a comparison map to help track them down. We tracked down a couple of these anomalies and added more detail to OSM than the OS Locator data suggests because the developments have moved on since OS added to their dataset.
In north Hull, around Kingswood, there is a a substantial development steadily being built. It keeps getting highlighted on OS Locator data as it gently expands. It is going slowly, probably because money is tight, but nonetheless it is gradually filling up the allocated space. Ground level of the development is below the level of the high embankments that retain the nearby meandering river Hull. The nearest higher ground reaches to a 10m contour about two kilometres away. Older maps show the former criss-cross pattern of drainage ditches leading to Engine drain and Wawne drain. Water from these drains has to be lifted by pumps (hence the name Engine drain) into the river Hull which wriggles its way through the city to the tidal Humber about five kilometres away. Some of the former farmland that this development is built on belonged to Ings farm and surrounds a very small woodland called Ings plantation. Ings is a local word meaning a water meadow or flooded meadow. Some of the trees in the plantation are alder, which grow in wet places, such as marshes or seasonally flooded areas. All this points to why no one built here before - flooding.
I'll add the development to OSM as it grows, but I wonder if it is also being added to maps in insurance companies as an area liable to flood.
Wednesday, 22 August 2012
OSM should not have a database
Openstreetmap should not have a database. Having a database positively hurts the whole community. There, I've said it and I feel better already.
Where there is a database there are nerdy types who want to normalise it, formalise the ontology of it, rationalise it, enhance its performance and all the other things computer science bods and other nerds love to do. They do it because their training or their gut feel tells them it must be an improvement that everyone will welcome it. They are wrong.
If OSM didn't have a database, it would be easier to explain that we don't do that, and we don't want you to do that either. It would be easier to direct these meddling nuisances to some other project, maybe opendatabasewrangling or openstringuntangling. That way we could keep the freedom to carefully choose the tags we use without the risk that some prat would mass-edit them into his view of an organised world, losing all the detail and nuances carefully placed there by hundreds of other mappers. The really, really annoying thing is that most of these people don't actually consume the data in a useful way, it just seems like a good idea to them. If they did use the data they would quickly see that selecting the data you want with a little preprocessing is easy and you always have to do this, so adding some extras to cope with variety is fairly simple. Write the code once and it works over and over again.
Of course we need to store the data somewhere and in reality that needs to be a database, such as the one we have. I must make it clear that I'm not criticising the database, it's design or the way it is managed or run at all, just the fact that something called a database attracts unwelcome urges from a few people. Maybe we could just stop calling it a database. Can we rename it to the tag-pile, or the OSM toy-box or anything that doesn't convey 'database'?
I wish the people who want to reduce the tags to a proscribed list well - I just wish them well somewhere outside of OSM. If they want an organised, limited list of tags, take OSM data and play with it in their world as they want to - just don't upload the changes as a mass-edit back into our toy-box. There is real value in nuanced data and, more importantly, real value in not upsetting the mappers whose carefully chosen tags get squashed to homogenised blandness by these unthinking mass-editors.
What would you renamethe database the place we store our data to?
Where there is a database there are nerdy types who want to normalise it, formalise the ontology of it, rationalise it, enhance its performance and all the other things computer science bods and other nerds love to do. They do it because their training or their gut feel tells them it must be an improvement that everyone will welcome it. They are wrong.
If OSM didn't have a database, it would be easier to explain that we don't do that, and we don't want you to do that either. It would be easier to direct these meddling nuisances to some other project, maybe opendatabasewrangling or openstringuntangling. That way we could keep the freedom to carefully choose the tags we use without the risk that some prat would mass-edit them into his view of an organised world, losing all the detail and nuances carefully placed there by hundreds of other mappers. The really, really annoying thing is that most of these people don't actually consume the data in a useful way, it just seems like a good idea to them. If they did use the data they would quickly see that selecting the data you want with a little preprocessing is easy and you always have to do this, so adding some extras to cope with variety is fairly simple. Write the code once and it works over and over again.
Of course we need to store the data somewhere and in reality that needs to be a database, such as the one we have. I must make it clear that I'm not criticising the database, it's design or the way it is managed or run at all, just the fact that something called a database attracts unwelcome urges from a few people. Maybe we could just stop calling it a database. Can we rename it to the tag-pile, or the OSM toy-box or anything that doesn't convey 'database'?
I wish the people who want to reduce the tags to a proscribed list well - I just wish them well somewhere outside of OSM. If they want an organised, limited list of tags, take OSM data and play with it in their world as they want to - just don't upload the changes as a mass-edit back into our toy-box. There is real value in nuanced data and, more importantly, real value in not upsetting the mappers whose carefully chosen tags get squashed to homogenised blandness by these unthinking mass-editors.
What would you rename
Thursday, 2 August 2012
Keeping stuff up-to-date
 It is all very well mapping an area, but things keep changing. A new £90 million hospital has just opened on the outskirts of Beverley and so as we passed it today we dropped in to grab a look around. Well, a look at just the grounds - I've had enough of the inside of hospitals. It was a bit unusual in two ways. Firstly there was a lot of car parking, so much so that there were many empty parking places. At the other local hospitals parking is a nightmare. The second thing was completely unexpected to me: an electric vehicle charging point. The two bays were labelled as Hybrid Vehicle Charging, but surely a hybrid doesn't need charging as much as a totally electric vehicle. A hybrid, by definition, has more than one means of power, whereas an electric vehicle needs to charge or stops.
I was able to trace the outline of the new building from the latest Bing imagery, which are very helpful, well aligned and now less than a year old - the previous ones were up to eleven years old. Nearby we spotted a new allotment site and a short detour helped add that to the map too. It is not a council site but a private one. It looks a good site. It was still a field on the new imagery, so it is pretty new.
As we drove through Beverley I noticed a lot of the residential streets have new 20 mph speed limits, so they all need surveying and updating. Speed limits don't take long to survey, so an hour wandering around should do it.
I rather enjoy looking for these changes and adding them to the map. I'm sure OSM is the only map to have both the hospital and the allotments on it right now - in fact how many other maps have allotments at all?
Friday, 29 June 2012
Leaflet vectors
Looking at a new-style speed limit made me realise that I might not have completed the speed limit tagging in Hull. I looked for a map showing speed limits as an overlay, struggled to find what I wanted and decided to put something together for myself. My last blog post about creating a map with overlays using leaflet seemed popular, so I thought I'd write up my experience here too.
I wanted to show a map with an overlay of roads that don't have a speed limit tag (maxspeed=*) so I can survey them and add the correct tag. I decided to extract all highway=* that are roads which could have speed limits, so not service roads or cycleways for example. The maxspeed tag (or absence of it) could drive an overlay to highlight missing ones and show the actual speed limits where there is a tag.
I thought I would extract the OSM data for an area, parse it to extract the relevant highways and store that in a database. Then create a page to display the map using AJAX and GeoJSON to deliver an overlay.
All of the scripts are on github, so you can download it from there. The README file includes some installation stuff to make it work for you. A working version is here, though the data will rapidly get out of date, so don't trust what you see - it is only an example.
First, get some data. I download the data for areas from Geofabrik's download server. Their service is excellent and by providing data that is less than a day old and cut into useful areas it is hard to beat. I downloaded the county data for East_Yorkshire_with_Hull. I usually download the data as .pbf a file. That can go straight into many utilities, but to use the data myself with Python I convert it to a .osm file first with osmosis.
I wrote some Python code to parse an OSM file long ago and I keep going back to it. It is included as python/osm.py. I wanted to find the ways tagged with highway. I wanted to narrow that down to a smaller group of highways: unclassified to motorways ignoring footways for example. I then wanted to load the ways into a database for use later. All of this is in the script called python/readlimits.py. My cheap and cheerful website host provides PHP and MySQL, so my database is MySQL. To draw the overlay on a map I need the list of nodes that make up the way, so I extracted them too and added them to a table too. The table layouts are in github folder database.
The script works through the ways that fit the requirements and extracts from the list of nodes that make up the way. From these it works out the most northerly, southerly, easterly and westerly of the nodes and stores this bounding box of the way. We want to show an overlay for the current part of the map being displayed and this bounding box for a way will allow that.
Loading the data for (38,000 ways and 350,000 nodes to work through) took a few minutes, loading 15,700 ways and 114,000 nodes.
Now to create a PHP script that gets called with a bounding box and returns the ways that fall, at least partially, into that area. This script will get called by an AJAX call so it needs to return data in the correct format for Leaflet to use. I use GeoJSON, which Leaflet handles well. Now we need to make a decision. Do we choose the things that get displayed and how it gets displayed in the PHP script that extracts the data or do we throw everything at the client and select there? I've decided to manage the process in the PHP. My interest is in finding which roads have no maxspeed tag, so I paint the overlay red with no tag and blue with tagged roads. The roads with a maxspeed tag get its text set for a popup, no maxspeed tag gets 'Not set'. The script is called getspeeds.php.
The HTML is simple, I create two columns side by side, managed by CSS. The map is displayed in a div, as always, this time called speedmap. The work is all done in the JavaScript showspeed.js, which has comments to guide you along. I have deliberately limited the minimum zoom to be 14 so not too much data is requested by AJAX.
I hope this will help anyone wondering about vector layers. If you have any questions, leave a comment and I'll try to answer it. If you have a better way of doing this, leave a comment linking to your solution and I'll ask you questions.
Monday, 25 June 2012
New 40 Zone
Making maps has made me look at my surroundings much more carefully. I have found things close to home that I didn't know existed and it has focussed my attention for detail. A couple of weeks ago we saw a speed limit sign which displayed the usual circular 40 speed limit, except it had the word zone written below it. We saw some more the other day and it seemed unusual, so I investigated some more. Finally I got an email from someone in the Highways department at East Riding of Yorkshire council. In it she stated
"Draft guidance from the Department for Transport on setting speed limits supports the introduction of lower limits on routes in rural areas where high speeds are inappropriate and there are significant numbers of leisure users such as cyclists, horse riders and walkers."
She goes on to explain,
"The implementation of a 40 zone requires less signage than a conventional 40mph speed limit, therefore is less intrusive on the rural environment. Special authorisation for the signs was sought from the Department for Transport. A Traffic Regulation Order is in place for the 40 zone, which means it is enforceable by the Police.
The routes selected for the zones are pilot schemes and are being closely monitored."
I find this both interesting and a little puzzling. Firstly I'm in favour of reducing traffic speeds on some rural roads. Fatal accident rates for both vehicles and cyclists is higher on some types of rural roads and one way to try to reduce this is slow down traffic. Speed limits alone won't help much unless they are enforced which seems highly unlikely on quiet rural roads, but it may help a little. Today I was driving along one of the newly changed roads at 40 mph being tail-gated by an impatient driver from behind and almost forced off the road by a Mercedes-moron coming the opposite way doing much, much more than 40 mph.

 The signs are subtly different. The initial 40 sign is the same size as normal but has the word ZONE below it. This is in upper case, which I think breaks the usual use of mixed case. 40 mph limits normally have small repeaters every few hundred metres to remind the drivers they are in a speed limit. This does not. It does have reminders every mile or so. To me this is too far apart. The sign carries a 40 mph circular sign at the same size as the beginning of the limit with 'ZONE reminder' below.
The road itself can have extra markings. Some parts have 40 roundels painted on the road occasionally and some parts have broken white lines painted down both sides of the road, but not at sharp corners.

 The end of the zone can either be the national speed limit or a lower limit such as 30 mph when the road enters a village, say. Where there used to be a simple 30 mph sign there now has to be a new sign with a plaque saying the 40 zone ends.
The only other zones I have come across are 20 mph zones such as ones outside schools. Some 20 mph areas are not zones, they are simply a 20 mph speed limit. I do wonder what kind of bureaucratic mind dreams up these subtleties in the Department for Transport and imposes the hapless motorist with these distractingly different signs?
One other point is that the guidance from the DfT is draft, so what happens if the final guidance does not include this kind of road or if the signage is different?
"Draft guidance from the Department for Transport on setting speed limits supports the introduction of lower limits on routes in rural areas where high speeds are inappropriate and there are significant numbers of leisure users such as cyclists, horse riders and walkers."
She goes on to explain,
"The implementation of a 40 zone requires less signage than a conventional 40mph speed limit, therefore is less intrusive on the rural environment. Special authorisation for the signs was sought from the Department for Transport. A Traffic Regulation Order is in place for the 40 zone, which means it is enforceable by the Police.
The routes selected for the zones are pilot schemes and are being closely monitored."
I find this both interesting and a little puzzling. Firstly I'm in favour of reducing traffic speeds on some rural roads. Fatal accident rates for both vehicles and cyclists is higher on some types of rural roads and one way to try to reduce this is slow down traffic. Speed limits alone won't help much unless they are enforced which seems highly unlikely on quiet rural roads, but it may help a little. Today I was driving along one of the newly changed roads at 40 mph being tail-gated by an impatient driver from behind and almost forced off the road by a Mercedes-moron coming the opposite way doing much, much more than 40 mph.

 The signs are subtly different. The initial 40 sign is the same size as normal but has the word ZONE below it. This is in upper case, which I think breaks the usual use of mixed case. 40 mph limits normally have small repeaters every few hundred metres to remind the drivers they are in a speed limit. This does not. It does have reminders every mile or so. To me this is too far apart. The sign carries a 40 mph circular sign at the same size as the beginning of the limit with 'ZONE reminder' below.
 The road itself can have extra markings. Some parts have 40 roundels painted on the road occasionally and some parts have broken white lines painted down both sides of the road, but not at sharp corners.

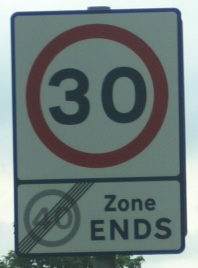 The end of the zone can either be the national speed limit or a lower limit such as 30 mph when the road enters a village, say. Where there used to be a simple 30 mph sign there now has to be a new sign with a plaque saying the 40 zone ends.
The only other zones I have come across are 20 mph zones such as ones outside schools. Some 20 mph areas are not zones, they are simply a 20 mph speed limit. I do wonder what kind of bureaucratic mind dreams up these subtleties in the Department for Transport and imposes the hapless motorist with these distractingly different signs?
One other point is that the guidance from the DfT is draft, so what happens if the final guidance does not include this kind of road or if the signage is different?
Tuesday, 12 June 2012
Open Data
I have been speaking to someone from a local council and they are keen to publish lots of data under an Open licence. Some of it is geo data and I'm interested in what benefit that might bring to OSM. I hope to have more to report soon.
Friday, 11 May 2012
Fire hydrant locations are confidential
Strolling around the village I saw a man working in the street. The van had a Humberside Fire and Rescue logo and the man was fixing a hydrant sign to a wall. A quick chat established that he was checking they were present and replacing imperial hydrant signs with metric ones. I asked him if any data about the location of the hydrants is available. He said he would ask someone to call me about it.
A little later I got a call from HF&R. I asked if the location of fire hydrants was available and was told in no uncertain terms that they were not. I explained about OpenStreetMap and the caller told me that OSM had no reason to add hydrants, adding that their locations are confidential. When I said that as the data is not available I would just continue to add the ones I see as part of surveys he repeated that their locations are confidential and added that they belong to Yorkshire Water, the local water company. He asked why I wanted to put hydrants into OSM and I told him that such details make a richer map.
The locations of hydrants are hardly confidential, there is a yellow sign showing where each one is. I was a bit surprised by the HF&R man's indignant reaction. It does seem that the notion of opening up data has not reached into that public body at all.
I have only added a few hydrants experimentally and stopped because it didn't seem worth the effort. I may add a few more, but not, it seems, based on HF&R data, and only under the cover of darkness.
Monday, 30 April 2012
Fungus
 |
| Fungus Auricularia auricula-judae |
Friday, 20 April 2012
With a bit of style
I have been working a little on a style in TileMill, using my laptop. The screen is 1366 x 768, so squeezing the display in is a nuisance. The TileMill page would be a bit better if the two main panes were able to be sized. The 1366 x 768 screen is now the most common screen size for a PC, so support could be better, maybe a tabbed layout might be better. The documentation is a bit sparse, but I have found my way around without too much hassle. Downloading the osm-bright example helped a lot. It is by far the easiest way to I have found to create a Mapnik style.
TileMill uses Mapnik to render the images and so Mapnik2 was installed as part of TileMill. I installed python-mapnik so I could run Mapnik stand-alone from a python script. TileMill offers to export the Mapnik style and I used that to make an image file.
Well, it should work, and it did. It was simple to do and I now have a style that I can use in Mapnik to render various places with my own style.
Now I can work on the style confident it will work.
Sunday, 15 April 2012
Blending your interests
OpenStreetMap has been interesting to me ever since I discovered it. It has led me to new and interesting places, many have been close to home. Like photography it crosses over with other interests, so when you visit somewhere you can map it too. I have added a few nature reserves as I have visited them, but usually mostly in outline, often based on the blend of some photos from a visit and some aerial imagery. The latest Bing aerial imagery makes it easy to mark the boundaries that are obvious.
Across the UK there are wildlife trusts, often each based in a single county. I've been a member of the Yorkshire Wildlife Trust for many years, and I've enjoyed their reserves both old and new, some of which are quite close to my home. I looked recently at their website and realized that their maps include an OSM layer, and naturally the reserves I've added show up there nicely. I say nicely - I actually don't like the way the Standard OSM layer renders them, with 'NR' sprinkled across them. That seems horribly English-centric and some transparent symbol or just a coloured background would be better, after all the name of the reserve will be rendered if possible.
I contacted YWT to say how I liked their use of OSM and was there any way we could work together to make sure all of their reserves appear on OSM. I hope that if we can add them all they would stop showing the Google layer, though an aerial view is useful. I know they need to add OSM attribution too, but I'm sure we can soon work that out.
A reply came back quickly saying they would like to work together and after some discussion we agreed to improve a local reserve on OSM to include as much detail as possible to see if we could not only make OSM better but use the data to perhaps make a purpose-made render for them to use elsewhere.
I have been out today surveying. I did get side-tracked into watching the avocets dancing and calling, but I gathered some useful details too.
A couple of features have made me stop and think. Firstly, there are often rafts in pools and lakes at nature reserves where birds can build nests, gulls and terns use them particularly. They are permanent enough to tag them, but how? I used man_made=pier, pier=nesting_raft for now, but someone might have a better suggestion. The other, slightly less specialist feature, is a mound or embankment. There is a footpath to a hide which lies between two embankments to keep people on the path from being seen by the wildlife and causing disturbance. If the path was on top of an embankment I would just add embankment=yes to the way for the path. If it was in a cutting I could add cutting=yes. I settled on drawing an outline of the embankment from imagery and using the tag man_made=embankment. It won't render on the Standard render, but that's not too important. There is another such mound, but this time for birds to burrow into for nests. I used the same idea to tag it. Rabbits seem to have taken it over.
My next job is to create a custom render for the reserve to see what is possible and I'm going to experiment with TileMill to see what I can produce. In the meantime you can see the latest render of the reserve here.
Across the UK there are wildlife trusts, often each based in a single county. I've been a member of the Yorkshire Wildlife Trust for many years, and I've enjoyed their reserves both old and new, some of which are quite close to my home. I looked recently at their website and realized that their maps include an OSM layer, and naturally the reserves I've added show up there nicely. I say nicely - I actually don't like the way the Standard OSM layer renders them, with 'NR' sprinkled across them. That seems horribly English-centric and some transparent symbol or just a coloured background would be better, after all the name of the reserve will be rendered if possible.
I contacted YWT to say how I liked their use of OSM and was there any way we could work together to make sure all of their reserves appear on OSM. I hope that if we can add them all they would stop showing the Google layer, though an aerial view is useful. I know they need to add OSM attribution too, but I'm sure we can soon work that out.
A reply came back quickly saying they would like to work together and after some discussion we agreed to improve a local reserve on OSM to include as much detail as possible to see if we could not only make OSM better but use the data to perhaps make a purpose-made render for them to use elsewhere.
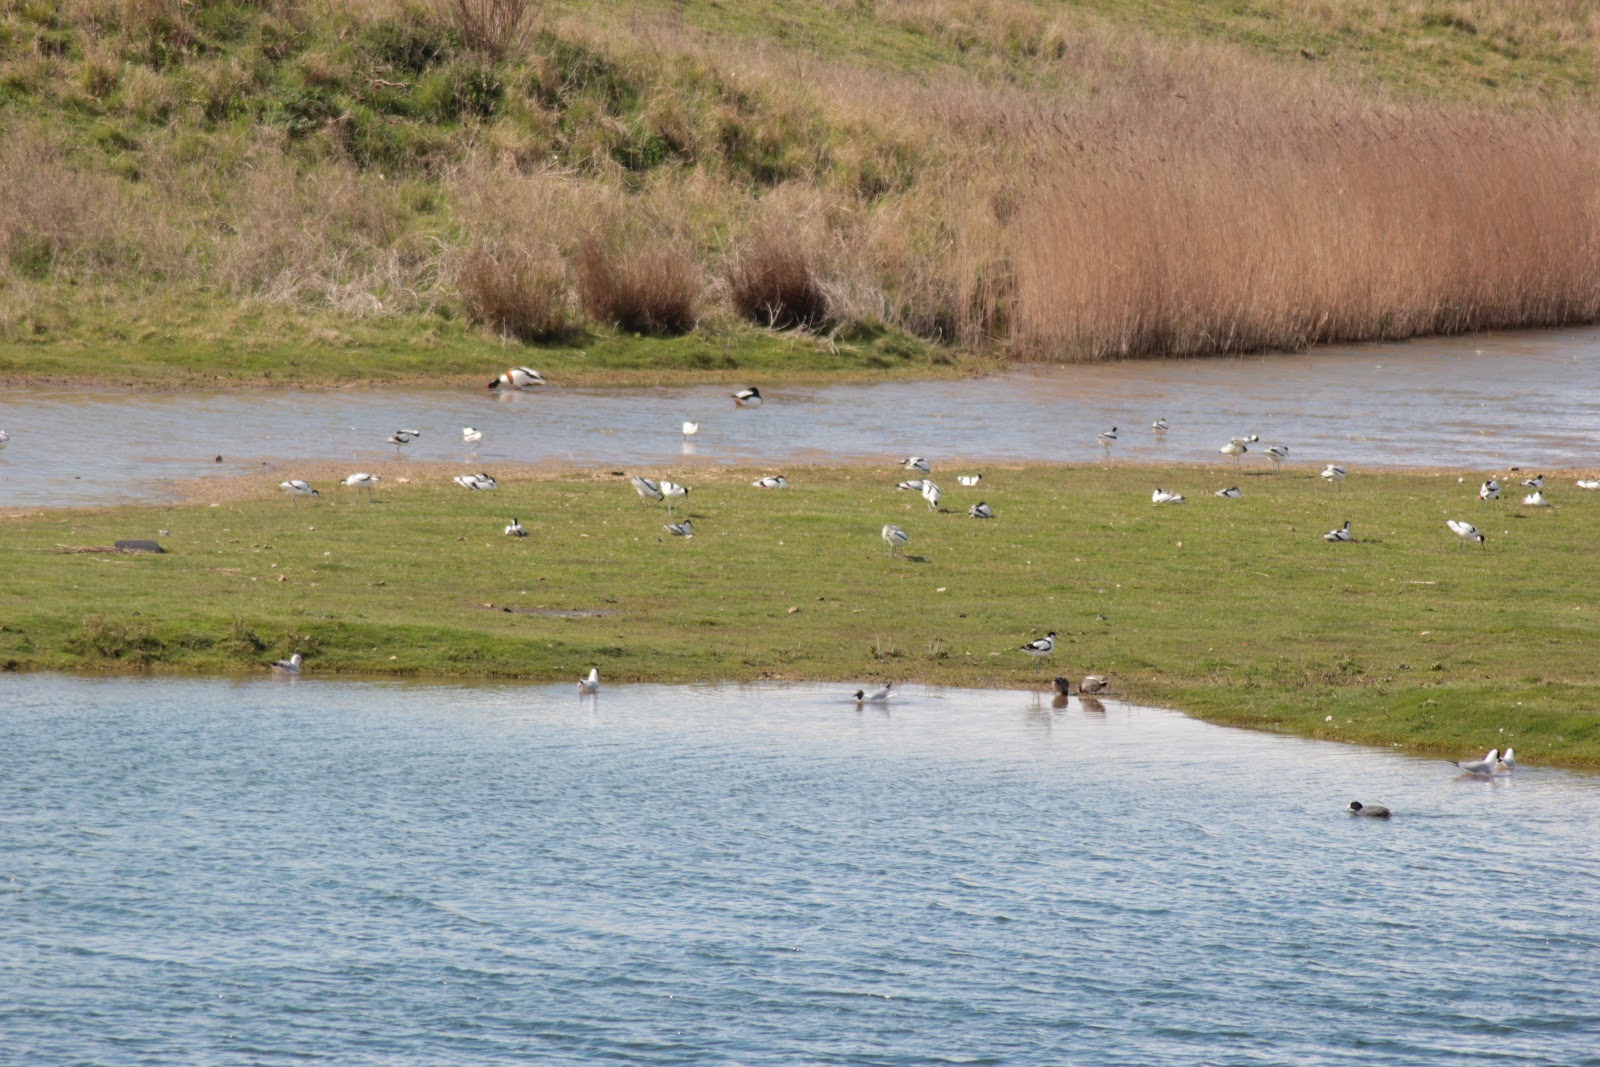 |
| Avocets |
 |
| A mound for nesting birds |
My next job is to create a custom render for the reserve to see what is possible and I'm going to experiment with TileMill to see what I can produce. In the meantime you can see the latest render of the reserve here.
Wednesday, 11 April 2012
Opening up Government
My postcode finder app has appeared on the data.gov.uk website which is titled Opening up Government. The page is here http://data.gov.uk/apps/chris-hill. The only other OpenStreetMap app there seems to be Cycylestreets, so I'm in good company, but room for more neighbours.
I'm not sure about the site's title. Not so much opening up government, more releasing public data to get it used in new and imaginative ways. In my case turning dry lists of postcodes into something useful and visual.
I'm not sure about the site's title. Not so much opening up government, more releasing public data to get it used in new and imaginative ways. In my case turning dry lists of postcodes into something useful and visual.
Tuesday, 3 April 2012
TileMill coast
While the OSM DB server is being upgraded and the data cannot be updated I thought I'd look at rendering. I've used Mapnik to do some rendering in the past. It is powerful, fast and uses the Anti-grain Geometry C++ templates which produce lovely sub-pixel rendering for clear thin lines, good colour contrasts and good quality curves and diagonals. The downside of Mapnik is its style sheets, which I don't think too many people get to grips with.
Recently I heard about TileMill so I thought I'd take a look. It installed very easily on my laptop running Ubuntu. A quick look at the results shows it is running node.js on my machine to provide the user interface through my browser. That works well and gives a slick and responsive interface. It also installed Mapnik, which is what renders the maps. TileMill can use various data sources such as shapefiles, GeoJSON, GeoTIFF and PostGIS. I already run PostGIS with some data imports for the existing rendering, so that was a place to start. This is data imported into tables in a way that makes rendering easier. I have just copied the data in the way the Standard map view on the OSM site uses it. This does not include all data from OSM for a selected area, only the data that the Mapnik style is set up to render.
When I created a new TileMill project it started by creating a layer to show the outline of the landmasses. I quickly zoomed in to see my local area. The coastline showed up the Humber Estuary and, as it should, it stopped abruptly at about the place the Humber bridge crosses. Beyond that it is not officially coastline but river. I have not yet imported any other data to show up the rest of the river system.
The first thing I tried to add were a few roads. Copying an example I created a layer that loaded some data from planet_osm_line, the dataset in the PostGIS db that holds an extract of linear things like roads. TileMill uses a language they call Carto to describe the selection and style of the objects to be displayed on the map. It is a lot like CSS. I copied a small piece of Carto code and on saving the code the map quickly redrew with some thin grey lines to show some roads. That was very satisfying. A few more lines of code and more road types appeared in various colours and thicknesses. Then I noticed a problem.
The coastline was rather crude and some roads strayed into the sea. I realised that what I needed was the OSM coastline to exactly match my OSM data. I looked around and found the processed_p shapefile which is a detailed OSM coastline. It was nearly 500MB uncompressed, but as I only want to work with GB data at the moment I loaded it into Quantum GIS and extracted the GB part and saved that separately as a shapefile. Once that shapefile was loaded as a layer in TileMill the detail jumped out and none of the roads were submerged any more. If you are interested in Birmingham none of this would matter. There may yet turn out to be a better way of using processed_p or some similar coastline.
I have a lot to look at yet but it is an interesting start. I want to be able to render an area as tiles to use in my own way with my own style and this looks very promising.
Sunday, 25 March 2012
More GB postcode goodness
I have loaded the CodePoint Open data into a database some time ago. It was released as part of the OpenData from Ordnance Survey, though it is Royal Mail data originally. As part of the bundle it provides the northing and easting of the centroid of GB postcodes. I converted these OS grid references into longitude and latitude using gdaltransform and loaded them into a database. I use this to make postcode overlay tiles for use in editors or on maps.
In a recent discussion with Dan Avis I realised that I hadn't done as originally intended and created a postcode finder. When I have the data to hand it seems daft not to go the final mile, so I have. You can see it here. It uses the lovely Leaflet library to display the map and I use a small trick to only show the postcodes at high enough zoom level. Whenever the map is redisplayed I check the zoom level and hide or show the postcode tiles as required.
I have deliberately separated the attribution from the map because the text was too long for the map size I liked. In a while I will have to see what attribution changes are needed, if any, to the various maps I have created as the licence changes.
Monday, 19 March 2012
Red shift
Red shift* is a phenomenon than makes things change their colour. It is usually applied to stars.
There are groups of people shifting the red from the OSMI licence change view by remapping the work of people who have declined the new licence or whom we cannot contact any more.
These shifters of red are stars, everyone of them and I thank them, along with the folks who built the tools to show what needs to be shifted. Bravo.
* red shift is caused as space that makes up the fabric of the universe is stretched because the universe is expanding. This stretches the light coming from distant stars changing its wavelength towards the red end of the spectrum, hence 'red shift'.
Saturday, 25 February 2012
The slog is over
I've been slogging through the roads in East Yorkshire. Sometimes literally and sometimes by looking at old photos from previous surveys. East Yorkshire now has a complete list of named roads compared to the OS OpenData Locator dataset. It actually has many more of course, there's heaps more detail in OSM than in the OS Opendata datasets. On the other hand OS has masses more fine detail than OSM, it just isn't available as open data.
The other part of the slog, though much simpler, has been to remap anything that will be lost or badly affected by the licence change process. All of East Yorkshire's and Hull's road networks are safe now and almost all of the footpaths, tracks, woods, lakes and other countryside details are safe too. Finding and contacting lapsed mappers has been the biggest part of this success. Everyone I contacted has agreed to the new licence (why wouldn't they?) but a few took some finding.
Now I can go back to pet projects, such as creating a tourist map of Hull with all of the features visitors might like, from museums and galleries, hotels and guest houses, pubs and restaurants to walking trails and cycleways. Some of these need extra survey work and the site needs designing ...
Tuesday, 7 February 2012
Captains' Heads and the Milky Way
There was snow on the ground at home. Any trip out in the car would need to be on main roads. Any trip out on foot would need to be very local and any trip out on a bike would be horrible. We opted for a car ride which included a quick stop to grab photos of a couple of blue plaques in Hull.
The area close to the railway station in Hull has been rebuilt over recent years. Did I say railway station? I meant the Paragon Interchange of course. It used to be the Paragon station with the bus station next door, now they are all under one roof. Next door is a shopping centre called St Stephens. Not, you'll notice, the St Stephens commodity-cash interchange, but maybe that is coming. The roads to the west were changed or even removed as part of the process. St Stephens Square disappeared but gave its name to the shopping centre. The Spring Street theatre, which had the Hull Truck Theatre Company based there, has been replaced by a new theatre called the Hull Truck, presumably because it is not on Spring Street any more.
 A short new road was added to give access to an area otherwise cut off by the development. This is called Milky Way. Far from being a galactic super highway, it is where Northern Dairies had a distribution depot before the redevelopment.
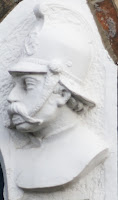
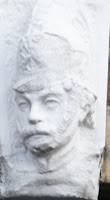
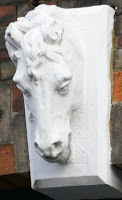
 The two plaques were easy to find, one being a plaque for Hull College which has had a presence in Park Street since 1898 and one being for a Volunteer Fire Brigade. The fire station had some carvings around the doorways that were good to see. The building is in reasonable condition and the carvings looked recently painted, to the extent that the layers of paint may be obscuring some of the detail in the carvings. The carvings were of firemen and horses. Apparently the firemen were the captains of the brigade at the time.
The carvings of horses showed they were as important to the brigade as their captains; horse-drawn engines being all that was available in 1887.
Worth a journey out in the snow.
The area close to the railway station in Hull has been rebuilt over recent years. Did I say railway station? I meant the Paragon Interchange of course. It used to be the Paragon station with the bus station next door, now they are all under one roof. Next door is a shopping centre called St Stephens. Not, you'll notice, the St Stephens commodity-cash interchange, but maybe that is coming. The roads to the west were changed or even removed as part of the process. St Stephens Square disappeared but gave its name to the shopping centre. The Spring Street theatre, which had the Hull Truck Theatre Company based there, has been replaced by a new theatre called the Hull Truck, presumably because it is not on Spring Street any more.
 A short new road was added to give access to an area otherwise cut off by the development. This is called Milky Way. Far from being a galactic super highway, it is where Northern Dairies had a distribution depot before the redevelopment.


 The two plaques were easy to find, one being a plaque for Hull College which has had a presence in Park Street since 1898 and one being for a Volunteer Fire Brigade. The fire station had some carvings around the doorways that were good to see. The building is in reasonable condition and the carvings looked recently painted, to the extent that the layers of paint may be obscuring some of the detail in the carvings. The carvings were of firemen and horses. Apparently the firemen were the captains of the brigade at the time.
The carvings of horses showed they were as important to the brigade as their captains; horse-drawn engines being all that was available in 1887.
Worth a journey out in the snow.
Tuesday, 31 January 2012
Coastal erosion
I've seen a report that shows the total erosion along parts of the East Yorkshire coast. The coast is one of the fastest eroding coastlines in Europe. The average rate of loss is about 2.5 metres each year, but last year there were unusually large losses in a few areas. South of Withernsea the cliff receded by ten metres. Near Waxholme seven metres disappeared.
Holderness is a rich agricultural plain east of Hull. The clay it is made of was deposited as the last glaciers melted about 10,000 years ago. As the sea level rose again separating England from modern-day Netherlands and Denmark the soft clay became the new coastline. The cliffs range from a metre to tens of metres high, but the action of the sea easily undercuts the cliff and then causes collapse. The very dry year last year may have contributed because the clay shrinks as it dries out, leaving fissures that make collapses easier. Most of the coast is not, now, defended so these loses will continue, but probably at the average rate overall.
Left to itself, in about 10,000 more years, the plain would probably erode back to the old coastline which was a limestone line marking the edge of the Yorkshire Wolds from Flamborough Head to Hessle on the bank of the Humber.
All this erosion makes keeping the OSM coastline up to date is hard work.
Sunday, 22 January 2012
Homogenised data? No thanks
I follow the changes made in the East Yorkshire area. Andy Ayre created a twitter feed for the area which generates tweets as osmeastriding. AndrewArm creates an RSS feed for the area too. Then there is the ITOWorld tool which is helps me look at the editors for a selected area.
Andy Ayre's twitter feed is based on a rectangle that encloses the county, so it also includes York, part of North Yorkshire and part of northern Lincolnshire too. It is very quick so edits appear only a few minutes after they were made and I check it every day. Andy's algorithm looks for changesets that fall within the rectangle, so big changesets that span the county are ignored whether objects in the county are edited or not.
AndrewArm's RSS feed is based on the polygon that describes the county and so it is more focussed. It is up to a day behind the edit. It does, however, show any edits in the county, including changesets that cover bigger areas than the county, so-called big edits.
ITOWorld's system will be familiar to many. It allows you to choose a rectangle to monitor and provides an RSS feed for changes in the selected area. This is a day or two behind the edits and the size of rectangle is limited and is much smaller than the size of East Yorkshire.
Monitoring an area reveals new mappers. Once they have made a few edits I usually send them a message saying 'Hi' and offering info or help. Newbies often want to check something or ask how to do something.
Monitoring also shows up vandalism. Speedy action means vandalism can be reverted without much risk. Reverting a vandal's edit means he may be dissuaded from doing it again, but at least the harm is limited.
Another thing that monitoring shows up are mass edits. Recently there seems to be a spate of them and some are harmful and annoying. When someone replaces a misspelt tag that is helpful. Changing Name=* to name=* or buildng=yes to building=yes would both benefit the object. However that is not what many mass edits are about. Some seem to be about homogenising the data, replacing the value part of tags with something generic. Sometimes a tag is removed and a replacement tag is added in its place.
I challenge the people who fire off these homogenising edits, which I dislike. The commonest excuse is that the wiki says the tag should be like this. This is infuriating. The wiki is full of controversy with edits chopping and changing the meaning of a tag back and forth. The open part of OpenStreetMap can be interpreted in many ways, and one way is that the tags that are used are open, that is any tag key and value is allowed. I also hear that TagInfo shows that value x is the most popular so every object must be changed to x. What TagInfo actually shows is that there are many uses of the key and that x is not the only way to use the tag, so why should they all be forced to be the same?
The second reason quoted is that how can the data be used if it is not consistent. Ontologies are mentioned. The odd thing is that people who say this are not the people who use the data for rendering, routing, analysis or whatever. The OSM data as derived from the API as XML (or pbf) needs to be processed to be used. That processing often loads the raw data into a database or processes it into a working file and that loading process can include catching a range of values that are useful for the render, analysis or whatever. If the variations of the key values are useful then they are used, but if some mass edit has flattened out the data into a monotonous grey, then those differences are not available. This processing will be a few lines of code, written once and used over and over without harming the detail at all. This is how landuse=cemetery and amenity=graveyard can be treated as the same thing or treated differently.
I know that a carefully chosen tag that gets splatted into some other meaning by a thoughtless mass edit is annoying. If that annoyance persuades a mapper to stop contributing to OSM that is a problem. Our most precious resource are our mappers and if a mass edit risks losing just one of them then that is a very serious indeed.
I have been accused of not wanting objects I created being changed; of being too protective. I'm not and that misses the point: OSM is a wiki. The objects are all open to edit every day. I just want those edits to improve the quality not squash it out.
Friday, 13 January 2012
New development for Hull
Yesterday we went to see the plans for an exciting new development in Hull. Kingston upon Hull sits alongside the Humber estuary and has docks along much of this waterfront. Some have been changed over the years - one has been filled in and turned into a sunken garden in the city centre, another filled in and and turned in to a housing development, one has a large shopping centre built over it on stilts, one has become a marina, but the biggest ones remain as commercial docks run by Associated British Ports. ABP have announced plans with Siemens to create GreenPortHull, a factory to build offshore wind turbines to be installed in the North Sea. The existing Alexandra dock will have the companies who use it moved to the next dock, King George dock, so that the whole of Alexandra dock can become GreenPortHull.
I talked to a helpful guy from ABP about the development and explained about OSM, which he seemed genuinely interested in. I decided to use his description and his flyer to create a mock up of the new GreenPortHull.I first rendered a small map of the way the dock looks now:

I then copied the data and edited the copy to change the shape of the dock area, alter the road, remove the footway and add the new cycleway around the north of the dock. I added a few captions (by cheating with adding some place nodes) and rendered the new map.

The result is interesting, and done in a few minutes could be a bit slicker, but with more time it could easily be great.
The development is almost universally welcomed in the city which should be building turbines in three years.
Tuesday, 10 January 2012
Plaques, blue or not

We then discovered that the next village has at least one (pictured) and maybe more judging by the heritage trail inscription. If I want to add these to OSM, and why not, I wondered what tags to use. The plaques are marking something of historic significance; something happened here, or someone special lived or worked here, or a building of significance is or was here. The historic tag seems appropriate, but what else? The Map Features wiki page lists many historic tags, the closest seems to be memorial, but that is not really what the plaques are. It does suggest it can be a 'plate on a wall', but I wonder if historic=plaque or historic=marker might not be better. I have used historic=memorial with memorial=blue_plaque too.
I have emailed Jez at openplaques.org to discuss this. He suggested connecting the OSM object to the openplaques object, which others have thought of too, especially Mappa-mercia. I like this idea, but as always there is no generic way to do this. I have used openplaques:id=* for now. Jez suggested ref=openplaques:id=xxxx. At first I liked the ref idea, but it is not verifiable on the ground - the id is not written on the plaque because it is made up by openplaques not the people who put them up. I think ref=* should be verifiable. I also don't like the extra "=" sign. I wonder if OSM needs a link_ref tag as a general linkage to outside references. That could be link_ref:openplaques=1234 but also link_ref:ERoY=xyz if the council (East Riding of Yorkshire) have a separate reference too.
It is important that databases outside of OSM do not expect OSM IDs to persist. It would be tempting to reverse the process and have openplaques store the OSM node id of the plaque, but these id are not guaranteed to remain unchanged. In the case of a blue plaque it is unlikely to be redrawn as a building described by a way rather than a node, but other objects certainly can be.
If you have plaques (blue or otherwise) near you to commemorate someone or something why not add them to OSM and openplaques.org. Then we can all
Subscribe to:
Posts (Atom)